Note
Go to the end to download the full example code.
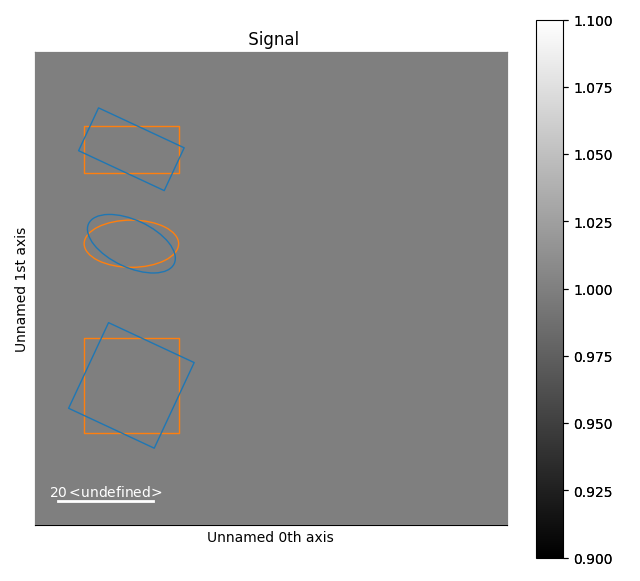
Rotation of markers#
This example shows how markers are rotated.
Create a signal
Create the markers, the first and second elements are at 0 and 20 degrees
# Define the position of the markers
offsets = np.array([20*np.ones(num)]*2).T
angles = np.arange(0, angle*num, angle)

m1 = hs.plot.markers.Rectangles(
    offsets=offsets,
    widths=np.ones(num)*20,
    heights=np.ones(num)*10,
    angles=angles,
    facecolor='none',
    edgecolor=color,
    )

m2 = hs.plot.markers.Ellipses(
    offsets=offsets + np.array([0, 20]),
    widths=np.ones(num)*20,
    heights=np.ones(num)*10,
    angles=angles,
    facecolor='none',
    edgecolor=color,
    )

m3 = hs.plot.markers.Squares(
    offsets=offsets + np.array([0, 50]),
    widths=np.ones(num)*20,
    angles=angles,
    facecolor='none',
    edgecolor=color,
    )
Plot the signals and add all the markers
s.plot()
s.add_marker([m1, m2, m3])
sphinx_gallery_thumbnail_number = 1
Total running time of the script: (0 minutes 0.280 seconds)