Note
Go to the end to download the full example code.
Transforms and Units#
This example shows how to use both the offset_transform and `transforms
parameters for markers
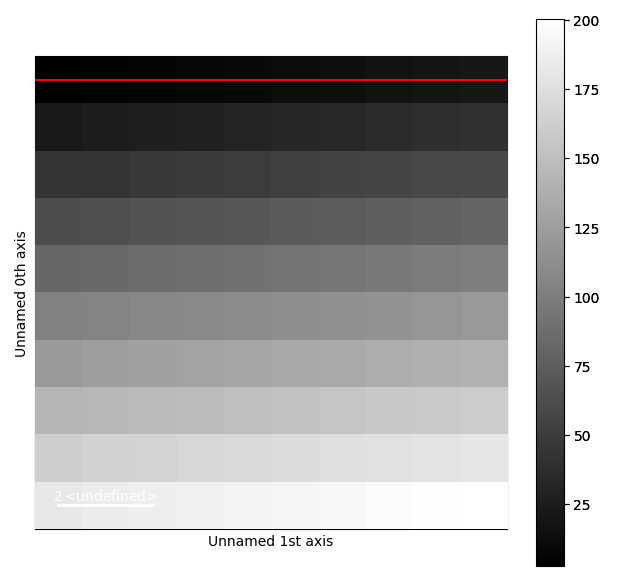
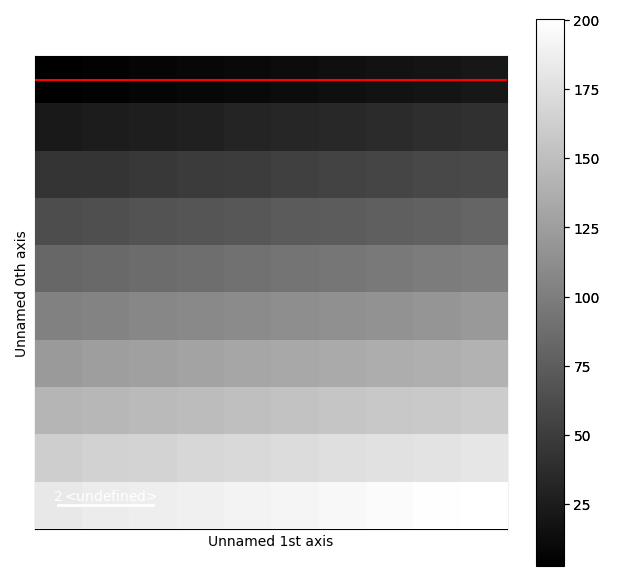
Create a signal
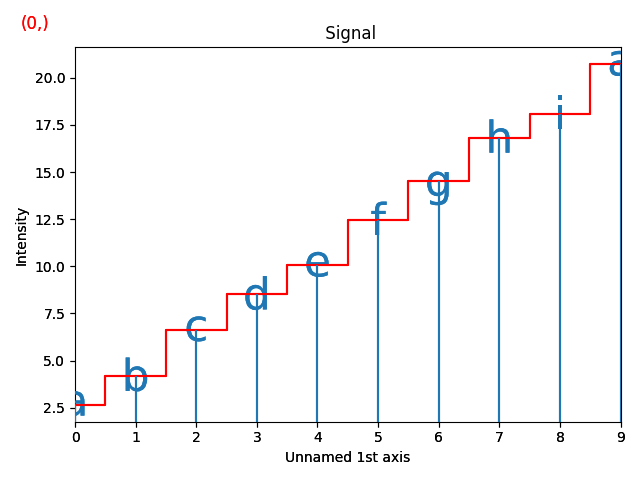
The first example shows how to draw markers which are relative to some 1D signal. This is how the EDS and EELS Lines are implemented in the exspy package.
segments = np.zeros((10, 2, 2)) # line segemnts for realative markers
segments[:, 1, 1] = 1  # set y values end (1 means to the signal curve)
segments[:, 0, 0] = np.arange(10).reshape(10)  # set x for line start
segments[:, 1, 0] = np.arange(10).reshape(10)  # set x for line stop

offsets = np.zeros((10,2)) # offsets for texts positions
offsets[:, 1] = 1  # set y value for text position ((1 means to the signal curve))
offsets[:, 0] = np.arange(10).reshape(10)  # set x for line start

markers = hs.plot.markers.Lines(segments=segments,transform="relative")
texts = hs.plot.markers.Texts(offsets=offsets,
                              texts=["a", "b", "c", "d", "e", "f", "g", "h", "i"],
                              sizes=10,
                              offset_transform="relative",
                              shift=0.005)  # shift in axes units for some constant displacement
signal.plot()
signal.add_marker(markers)
signal.add_marker(texts)
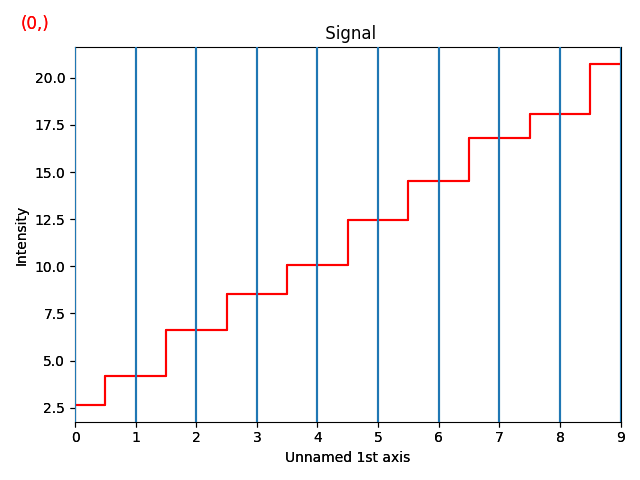
The second example shows how to draw markers which extend to the edges of the axes. This is how the VerticalLines and HorizontalLines markers are implemented.
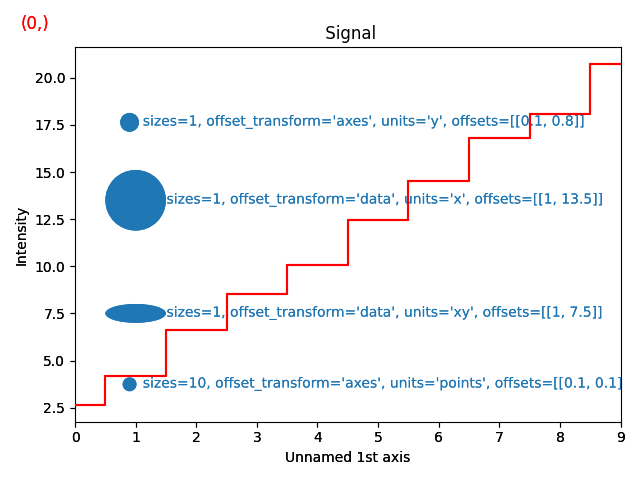
The third example shows how an offset_transform of 'axes' can be
used to annotate a signal.
The size of the marker is specified in units defined by the transform,
in this case "xaxis_scale", "yaxis_scale" or "display"
offsets = [[1, 13.5], ]  # offsets for positions
sizes =1
units = 'x'
offset_transform = 'data'
string = (f"       sizes={sizes}, offset_transform='{offset_transform}', units='{units}', offsets={offsets}",)

marker1text = hs.plot.markers.Texts(offsets=offsets,
                                    texts=string,
                                    sizes=1,
                                    horizontalalignment="left",
                                    verticalalignment="baseline",
                                    offset_transform=offset_transform)

marker = hs.plot.markers.Points(offsets=offsets,
                      sizes=sizes, units=units, offset_transform=offset_transform)


offsets = [[.1, .1], ]  # offsets for positions
sizes =10
units = 'points'
offset_transform = 'axes'
string = (f"   sizes={sizes}, offset_transform='{offset_transform}', units='{units}', offsets={offsets}",)

marker2text = hs.plot.markers.Texts(offsets=offsets,
                                    texts=string,
                                    sizes=1,
                                    horizontalalignment="left",
                                    verticalalignment="baseline",
                                    offset_transform=offset_transform)

marker2 = hs.plot.markers.Points(offsets=offsets,
                      sizes=sizes, units=units, offset_transform=offset_transform)


offsets = [[.1, .8], ]  # offsets for positions
sizes =1
units = 'y'
offset_transform = 'axes'
string = (f"   sizes={sizes}, offset_transform='{offset_transform}', units='{units}', offsets={offsets}",)

marker3text = hs.plot.markers.Texts(offsets=offsets,
                                    texts=string,
                                    sizes=1,
                                    horizontalalignment="left",
                                    verticalalignment="baseline",
                                    offset_transform=offset_transform)

marker3 = hs.plot.markers.Points(offsets=offsets,
                      sizes=sizes, units=units, offset_transform=offset_transform)


offsets = [[1, 7.5], ]  # offsets for positions
sizes =1
units = 'xy'
offset_transform = 'data'
string = (f"       sizes={sizes}, offset_transform='{offset_transform}', units='{units}', offsets={offsets}",)

marker4text = hs.plot.markers.Texts(offsets=offsets,
                                    texts=string,
                                    sizes=1,
                                    horizontalalignment="left",
                                    verticalalignment="baseline",
                                    offset_transform=offset_transform)

marker4 = hs.plot.markers.Points(offsets=offsets,
                      sizes=sizes, units=units, offset_transform=offset_transform)


signal.plot()
signal.add_marker(marker)
signal.add_marker(marker1text)
signal.add_marker(marker2)
signal.add_marker(marker2text)
signal.add_marker(marker3)
signal.add_marker(marker3text)
signal.add_marker(marker4)
signal.add_marker(marker4text)
sphinx_gallery_thumbnail_number = 2
Total running time of the script: (0 minutes 2.289 seconds)

