Ctrl+K
HyperSpy API is changing in version 2.0, see the release notes!

HyperSpy

  • User Guide
  • Examples
  • Reference
  • Get Help
  • Release Notes
  • Contribute
  • Tutorial
  • GitHub
  • Gitter
  • HyperSpy
  • User Guide
  • Examples
  • Reference
  • Get Help
  • Release Notes
  • Contribute
  • Tutorial
  • GitHub
  • Gitter
  • HyperSpy

Section Navigation

  • Markers
    • Ragged Points
    • Arrow markers
    • Vertical Line Markers
    • Circle Markers with Radius Dependent Coloring
    • Text Markers
    • Line Markers
    • Varying number of arrows per navigation position
    • Circle Markers
    • Filled Circle Markers
    • Rotation of markers
    • Add/Remove items from existing Markers
    • Polygon Markers
    • Ellipse markers
    • Square Markers
    • Star Markers
    • Rectangle Markers
    • Arrow markers
    • Creating Markers from a signal
    • Transforms and Units
  • Signal Creation and plotting
    • Creates a signal1D from a text file
    • Creates a line spectrum
    • Creates a signal1D from tabular data
    • Creates a 3D image
    • Creates a spectrum image
    • Creates a 4D image
  • Loading, saving and exporting
    • Export single spectrum
  • Model fitting
    • Plot Residual
    • Simple arctan fit
  • Region of Interest
    • SpanROI on signal axis
    • Interactive integration of one dimensional signal
  • Simple simulations
    • Simple simulation (2 Gaussians)
  • Gallery of Examples
  • Region of Interest

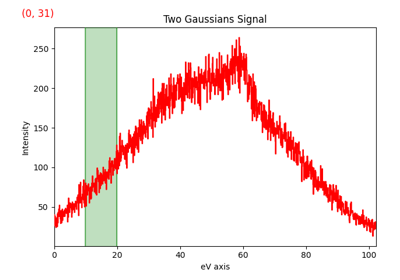
Region of Interest#

Below is a gallery of examples on using regions of interest with HyperSpy signals.

SpanROI on signal axis

SpanROI on signal axis

Interactive integration of one dimensional signal

Interactive integration of one dimensional signal

previous

Simple arctan fit

next

SpanROI on signal axis

Show Source

© Copyright 2011-2024, The HyperSpy development team.

Created using Sphinx 7.3.7.

Built with the PyData Sphinx Theme 0.15.4.