Available actions#
Most menu entries and toolbar buttons trigger an action when clicked. This is a rather loose definition, but actions are different from Tools and Widgets.
The list below is sorted on category, which roughly corresponds to the toolbar/menu in which they appear.
File#
Open#
Open a dialog to let the user interactively browse for files. It then loads
these files using hyperspy.api.load() before plotting the loaded
signals.
Open Stack#
Open files and combine the loaded signals into one signal (stacked).
Close#
Close the selected signal(s).
Save#
Save the selected signal(s).
Save figure#
Save the currently active figure using matplotlib’s
savefig(). Note that this does not care
about how the figure was produced, or the underlying resolution of the data.
New editor#
Opens a new Code editor widget.
Close All (signals)#
Close all signals. This can sometimes help clear out signals that get stuck in an invalid state.
Exit#
Close the application.
Signal#
Signal type#
Changes the signal type using set_signal_type()
Signal data type#
Change the data type use to store the signal data internally. See
the numpy docs for details. The operation is performed by
change_dtype().
Manual align#
Interactively align the signal. Navigate through the signal stack, and shift each point individually. This will also shift all the following points by the same amount. During input, the images are simply looped around the edges, but for final processing the signal dimensions will be expanded to fit the aligned signal.
Statistics#
Print the signal statistics to the console. See
print_summary_statistics() for details.
Histogram#
Plot a histogram of the signal. See
get_histogram() for details. The method
for determining the number of bins can be set in the Settings.
Rebin#
Opens a dialog to rebin the signal. See
rebin() for details.
Model#
Create Model#
Add and plot a default model for the selected signal. Note that the Signal type is important in order to create the correct model type.
The newly created model is accessible through the Data view.
Add component#
Add a component to the currently selected model.
The newly created component is accessible through the Data view.
Plot components#
Toggle the plotting of each component together with the model, as performed
by enable_plot_components().
Adjust component positions#
Add/remove widgets to adjust the position of the components in the model, as
performed by enable_adjust_position().
Decomposition#
PCA#
Performs decomposition if neccessary, then plots the scree for selecting the
number of components to use for a decomposition model. The selection is made
by clicking on the in the scree plot on the first component to
not be included in the decomposition. The scree plot will then automatically
close and the decomposition model plotted (see
decomposition() and
get_decomposition_model()).
BSS#
Performs decomposition if neccessary, then plots the scree for selecting the
number of components to use for a blind source separation. The selection
is made by clicking in the scree plot on the first component to
not be included in the decomposition. The scree plot will then automatically
close and the BSS algortihm run (see
blind_source_separation() and
plot_bss_results()).
Decomposition results#
Performs decomposition if necessary, then plots the decomposition results
according to the hyperspy’s
plot_decomposition_results().
Spectrum#
Smooth Savitzky-Golay#
Apply a Savitzky-Golay filter. See
smooth_savitzky_golay() for details.
Smooth Lowess#
Apply a Lowess smoothing filter. See
smooth_lowess() for details.
Smooth Total variation#
Total variation data smoothing. See
smooth_tv() for details.
Butterworth filter#
Apply a Butterworth filter. See
filter_butterworth() for details.
Hanning taper#
Apply a Hanning taper to both ends of the data. See
hanning_taper() for details.
EELS#
Remove Background#
Interactively define the background, and remove it. See
remove_background() for details.
Fourier Ratio Deconvoloution#
Use the Fourier-Ratio method to deconvolve one signal from another.
Note
The background should be removed with e.g. Remove Background before running Fourier ratio deconvolution.
See fourier_ratio_deconvolution()
for details.
Estimate thickness#
Estimates the thickness (relative to the mean free path) of a sample using
the log-ratio method. See
exspy.signals.EELSSpectrum.estimate_thickness() for details.
Browse EELSDB#
Browse the EELSDB online database of standard EEL spectra.
Image#
Gaussian Filter#
Opens a dialog to interactively apply a gaussian smoothing filter.
Rotate#
Opens a dialog to interactively rotate an image. Works on images in both navigation and signal space.
Diffraction#
Virtual aperture#
Add a virtual aperture to the diffraction image. The aperture can be moved around and resized, allowing for an interactive creation of virtual BF/DF images.
Virtual navigator#
Set the navigator intensity by a virtual aperture.
Note
Setting a virtual navigator will replot the signal, so any existing apertures will be lost. Therefore always add the virtual navigator first if you want to use one.
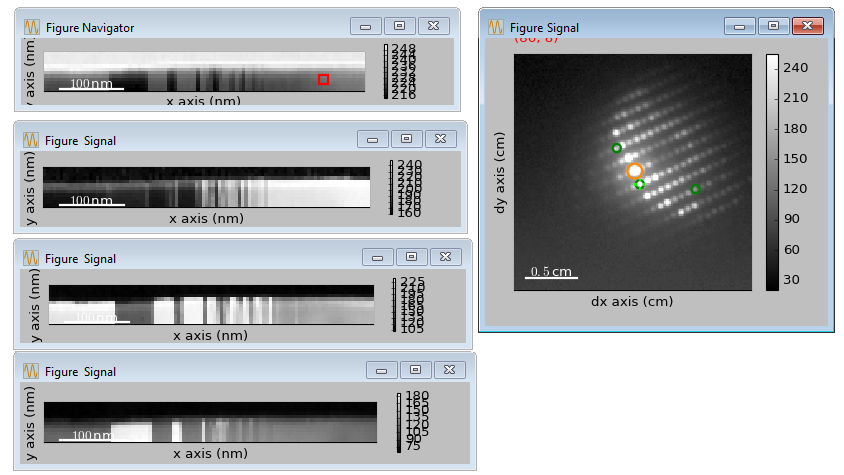
Example of a signal with a virtual navigator and three virtual apertures. The navigator (orange circle) selects the direct beam, giving a virtual bright-field image, while the other apertures select diffraction spots unique to three different grains/phases.#
Virtual annulus#
Add a virtual annulus to the diffraction image. An annulus is simply a hollow disc, and it can be moved around and resized, allowing for an interactive creation of virtual annular dark field images.
Math#
Mean#
Plot the mean of the current signal across all navigation axes.
Sum#
Plot the sum of the current signal across all navigation axes.
Maximum#
Plot the maximum of the current signal across all navigation axes.
Minimum#
Plot the sum of the current signal across all navigation axes.
Std#
Plot the standard deviation of the current signal across all navigation axes.
Variance#
Plot the variances of the current signal. across all navigation axes
FFT#
Perform a fast fourier transform on the active part of the signal.
Live FFT#
Perform a fast fourier transform on the active part of the signal. The live FFT updates the FFT as the signal is navigated.
Signal FFT#
Perform a fast fourier transform on the entire signal, not just the active part.
Inverse FFT#
Perform an inverse fast fourier transform on the active part of the signal.
Inverse Signal FFT#
Perform an inverse fast fourier transform on the entire signal.
Plot#
Tight layout#
Apply a tight layout to the selected plot. This is basically a workaround for the not so ideal basic layout for matplotlib figures, especially if they have been resized.
Settings#
Version selector#
Open dialog to select branch/version of HyperSpy/HyperSpyUI.
Warning
This can invalidate your installation of HyperSpyUI and/or HyperSpy. Use with caution!
Opens up a dialogbox that enables you to install a specific GitHub branch for HyperSpy and HyperSpyUI. This will basically download and install the selected branch using pip, whether or not that version works or if the HyperSpy and HyperSpyUI verions are internally compatible, or even compatible with your version of Python. As this can prevent you from starting the application afterwards, you might end up having to reinstall it.
Note
If your current installation is a git repository, this will check out the selected branch instead of doing a pip install.
Check for updates#
Checks for updates to HyperSpy and HyperSpyUI. If the packages are not source installs, it checks for a new version on PyPI.
Plugin manager#
Show the plugin manager dialog (see
Plugin manager widget and
PluginManager).
Reset layout#
Resets layout of toolbars and widgets.
HyperSpy settings#
Edit the HyperSpy package settings.
Edit styles#
Shows a dialog for editing the palette and stylesheet of the application. See the Qt documentation for usage: https://doc.qt.io/qt-5/stylesheet-reference.html and https://doc.qt.io/qt-5/qpalette.html.
Edit settings#
Shows a dialog for editing the application and plugins settings. See
Windows#
Tile#
Arranges all figures in a tile pattern.
Cascade#
Arranges all figures in a cascade pattern.
Close all (windows)#
Closes all matplotlib figures.