Widgets#
Data view#
The data tree widget is a core component of the UI, as it lists all the currently loaded signals and models. It can also be used to achieve some common tasks such as replotting the signal/model, closing a signal, deleting a model, and hiding/showing all the plots of a signal. While useful for normal signals, it is almost a necessity for managing models and their components. Each model and component are listed hierarchically in the tree view, and clicking the components shows an editor for manipulating the parameters of the component. Right clicking on the different models and components also allows acces to some actions that are unavailable elsewhere.
For all models:
- Plot
Plot the model, or replot it if already plotted.
- Fit
Fit the currently active spectrum
- Multifit
Fit all the spectra in the current signal
- Set signal range
Constrict the signal range used for the fitting routines
- Delete
Delete the model
- Add component
Adds a component of the given type to the model
Additional actions for hyperspy.models.EELSModel:
- Set low-loss
Specify the corresponding low-loss signal for a core-loss signal.
- Enable fine structure
See
hyperspy.models.EELSModel.enable_fine_structure()for details on what this does.
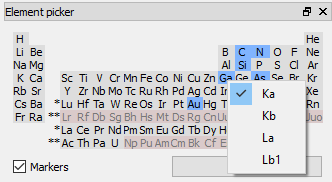
Element picker#
The element picker is a miniature periodic table. If an
EDSSpectrum or
EELSSpectrum is selected it can be used to add
elements to the signal. For EDS spectra, right clicking on the elements
will allow the selection of specific xray lines to add. The different EDX lines
can be indicated on the plot by checking the ‘Markers’ checkbox, and
integrated intensity maps of the α-lines can be created by clicking the ‘Maps’
button (see get_lines_intensity
for details).
Contrast control#
Use HyperSpy contrast adjustment tool by pressing the h key.
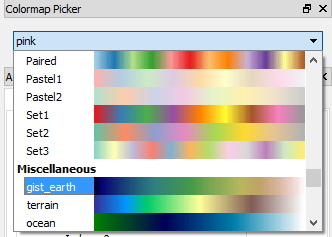
Colormap picker#
A CMapPickerWidget type widget for
changing the colormap of image plots. The dropdown shows all the colormaps
available in matplotlib, grouped by category. It also shows a preview of
the colorscale alongside the name.
Axes configuration#
Axes order#
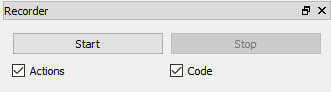
Recorder widget#
The record widget offers controls to turn on or off recording to a dedicated Code editor widget. Two checkboxes allow for selecting what should be recorded. See Recording code for details on what is recorded, and how it can be used.
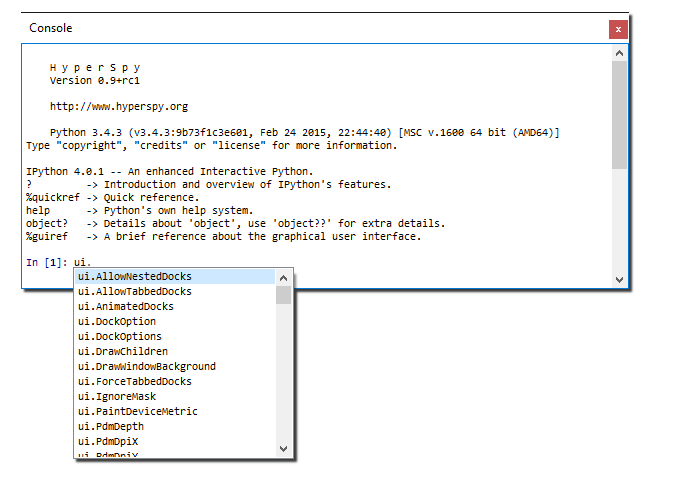
Console widget#
The console widget is a qtconsole console widget running IPython, and can run any code that IPython can. For details on how to successfully use it, see the Internal Console section.