

Note
Go to the end to download the full example code.
Get spectra from the EELS database#
This example demonstrates how to load EELS spectra from the EELS database in eXSpy.
import exspy
import hyperspy.api as hs
Load a core-loss and low-loss EELS spectra from a Ti3Ni4 alloy from the EELS database. The order parameter is set to “spectrumType” to load the low-loss spectrum as the first item and the core-loss spectrum as the second item.
cl, ll = exspy.data.eelsdb(element=["Ti", "Ni"], order="spectrumType")
  0%|          | 0/2 [00:00<?, ?it/s]
 50%|█████     | 1/2 [00:00<00:00,  1.95it/s]
100%|██████████| 2/2 [00:01<00:00,  1.48it/s]
100%|██████████| 2/2 [00:01<00:00,  1.54it/s]
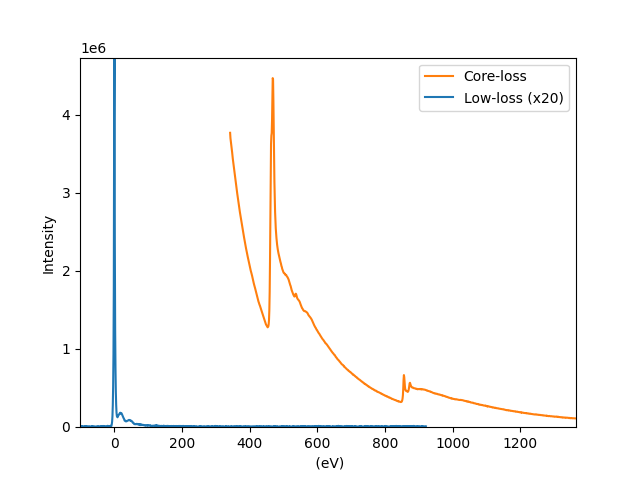
Plot both spectra. The core-loss spectrum contains the Ti L2,3 edge at around 450 eV, and the Ni L2,3 edge at around 850 eV, while the low-loss spectrum contains the zero-loss peak and plasmon peaks.
hs.plot.plot_spectra([ll * 20, cl], legend=["Low-loss (x20)", "Core-loss"])
<Axes: xlabel=' (eV)', ylabel='Intensity'>
Total running time of the script: (0 minutes 1.837 seconds)