Interactive Operations and Region of Interest (ROI)
Interactive operations
The function interactive() simplifies the definition of
operations that are automatically updated when an event is triggered. By
default the operation is recomputed when the data or the axes of the original
signal is changed.
>>> s = hs.signals.Signal1D(np.arange(10.))
>>> ssum = hs.interactive(s.sum, axis=0)
>>> ssum.data
array([45.0])
>>> s.data /= 10
>>> s.events.data_changed.trigger(s)
>>> ssum.data
array([ 4.5])
Interactive operations can be performed in a chain.
>>> s = hs.signals.Signal1D(np.arange(2 * 3 * 4).reshape((2, 3, 4)))
>>> ssum = hs.interactive(s.sum, axis=0)
>>> ssum_mean = hs.interactive(ssum.mean, axis=0)
>>> ssum_mean.data
array([ 30.,  33.,  36.,  39.])
>>> s.data
array([[[ 0,  1,  2,  3],
        [ 4,  5,  6,  7],
        [ 8,  9, 10, 11]],

       [[12, 13, 14, 15],
        [16, 17, 18, 19],
        [20, 21, 22, 23]]])
>>> s.data *= 10
>>> s.events.data_changed.trigger(obj=s)
>>> ssum_mean.data
array([ 300.,  330.,  360.,  390.])
Region Of Interest (ROI)
ROIs can be defined to select part of any compatible signal and may be applied either to the navigation or to the signal axes. A number of different ROIs are available:
Once created, an ROI can be applied to the signal:
>>> s = hs.signals.Signal1D(np.arange(2000).reshape((20,10,10)))
>>> im = hs.signals.Signal2D(np.arange(100).reshape((10,10)))
>>> roi = hs.roi.RectangularROI(left=3, right=7, top=2, bottom=5)
>>> sr = roi(s)
>>> sr
<Signal1D, title: , dimensions: (4, 3|10)>
>>> imr = roi(im)
>>> imr
<Signal2D, title: , dimensions: (|4, 3)>
ROIs can also be used interactively with widgets.
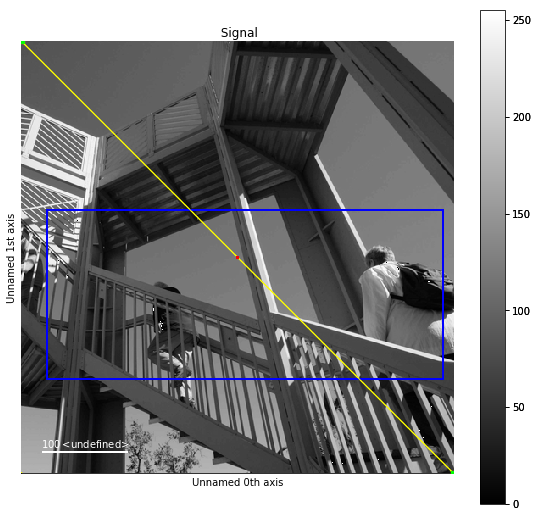
The following example shows how to interactively apply ROIs to an image. Note
that it is necessary to plot the signal onto which the widgets will be
added before calling interactive().
>>> import scipy.misc
>>> im = hs.signals.Signal2D(scipy.misc.ascent())
>>> rectangular_roi = hs.roi.RectangularROI(left=30, right=500,
... top=200, bottom=400)
>>> line_roi = hs.roi.Line2DROI(0, 0, 512, 512, 1)
>>> point_roi = hs.roi.Point2DROI(256, 256)
>>> im.plot()
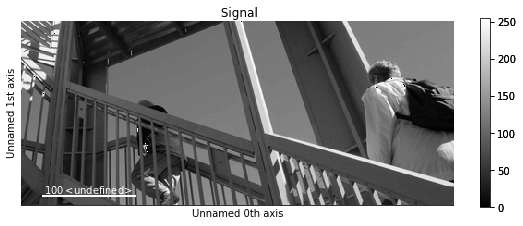
>>> roi2D = rectangular_roi.interactive(im, color="blue")
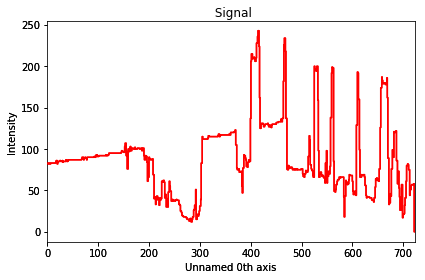
>>> roi1D = line_roi.interactive(im, color="yellow")
>>> roi0D = point_roi.interactive(im, color="red")
Note
Depending on your screen and display settings, it can be difficult to pick or manipulate widgets and you can try to change the pick tolerance in the HyperSpy plot preferences. Typically, using a 4K resolution with a small scaling factor (<150 %), setting the pick tolerance to 15 instead of 7.5 makes the widgets easier to manipulate.
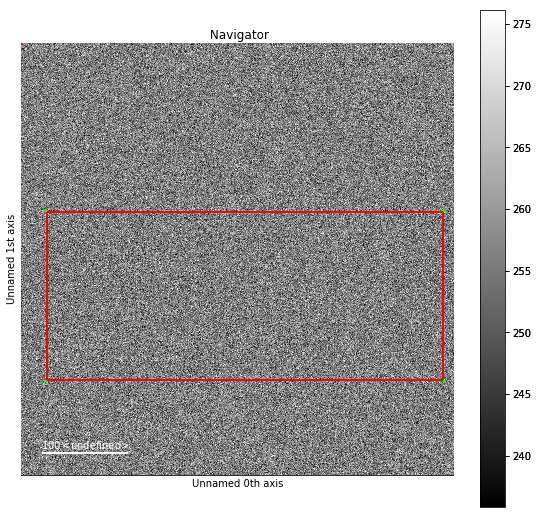
Notably, since ROIs are independent from the signals they sub-select, the widget can be plotted on a different signal altogether.
>>> import scipy.misc
>>> im = hs.signals.Signal2D(scipy.misc.ascent())
>>> s = hs.signals.Signal1D(np.random.rand(512, 512, 512))
>>> roi = hs.roi.RectangularROI(left=30, right=77, top=20, bottom=50)
>>> s.plot() # plot signal to have where to display the widget
>>> imr = roi.interactive(im, navigation_signal=s, color="red")
>>> roi(im).plot()
ROIs are implemented in terms of physical coordinates and not pixels, so with proper calibration will always point to the same region.
And of course, as all interactive operations, interactive ROIs are chainable. The following example shows how to display interactively the histogram of a rectangular ROI. Notice how we customise the default event connections in order to increase responsiveness.
>>> import scipy.misc
>>> im = hs.signals.Signal2D(scipy.misc.ascent())
>>> im.plot()
>>> roi = hs.roi.RectangularROI(left=30, right=500, top=200, bottom=400)
>>> im_roi = roi.interactive(im, color="red")
>>> roi_hist = hs.interactive(im_roi.get_histogram,
...                           event=roi.events.changed,
                              bins=150, # Set number of bins for `get_histogram`
...                           recompute_out_event=None)
>>> roi_hist.plot()
New in version 1.3: ROIs can be used in place of slices when indexing and to define a
signal range in functions taken a signal_range argument.
All ROIs have a gui() method that displays an user interface if
a hyperspy GUI is installed (currently only works with the
hyperspy_gui_ipywidgets GUI), enabling precise control of the ROI
parameters:
>>> # continuing from above:
>>> roi.gui()
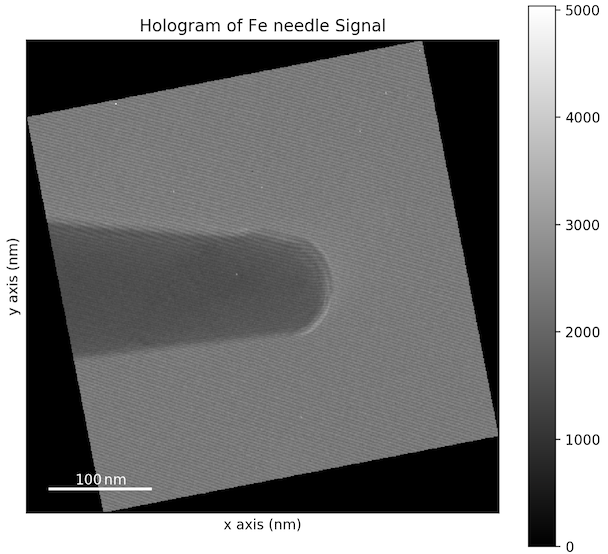
New in version 1.4: angle() can be used to calculate an angle between
ROI line and one of the axes providing its name through optional argument axis:
>>> import scipy
>>> holo = hs.datasets.example_signals.object_hologram()
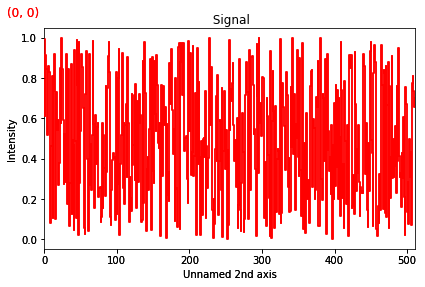
>>> roi = hs.roi.Line2DROI(x1=465.577, y1=445.15, x2=169.4, y2=387.731, linewidth=0)
>>> holo.plot()
>>> ss = roi.interactive(holo)
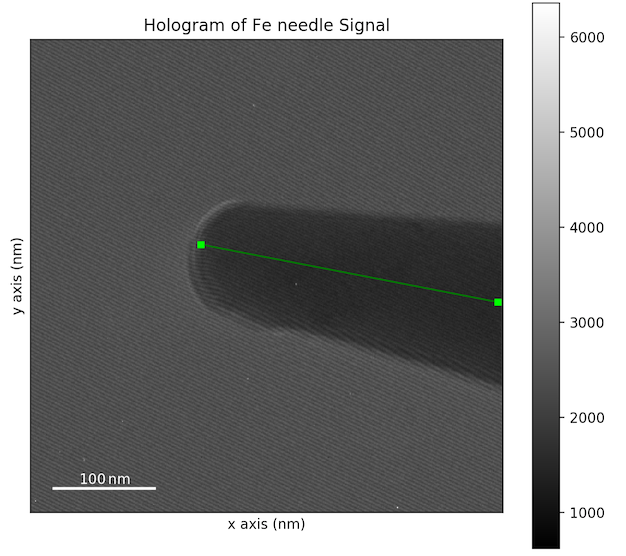
>>> roi.angle(axis='y')
-100.97166759025453
The default output of the method is in degrees, though radians can be selected as follows:
>>> roi.angle(axis='vertical', units='radians')
-1.7622880506791903
Conveniently, angle() can be used to rotate an image to
align selected features with respect to vertical or horizontal axis:
>>> holo.map(scipy.ndimage.rotate, angle=roi.angle(axis='horizontal'), inplace=False).plot()
Slicing using ROIs
ROIs can be used in place of slices when indexing. For example:
>>> s = hs.datasets.example_signals.EDS_TEM_Spectrum()
>>> roi = hs.roi.SpanROI(left=5, right=15)
>>> sc = s.isig[roi]
>>> im = hs.datasets.example_signals.object_hologram()
>>> roi = hs.roi.RectangularROI(left=120, right=460., top=300, bottom=560)
>>> imc = im.isig[roi]
New in version 1.3: gui() method.
New in version 1.6: New __getitem__() method for all ROIs.
In addition the following all ROIs have a py:meth:__getitem__ method that enables
using them in place of tuples.
For example, the method align2D() takes a roi
argument with the left, right, top, bottom coordinates of the ROI.
Handily, we can pass a RectangularROI ROI instead.
>>> import hyperspy.api as hs
>>> import numpy as np
>>> im = hs.signals.Signal2D(np.random.random((10,30,30))
>>> roi = hs.roi.RectangularROI(left=2, right=10, top=0, bottom=5))
>>> tuple(roi)
(2.0, 10.0, 0.0, 5.0)
>>> im.align2D(roi=roi)