Data Visualization#
This gallery shows how to plot data using the convenience functions
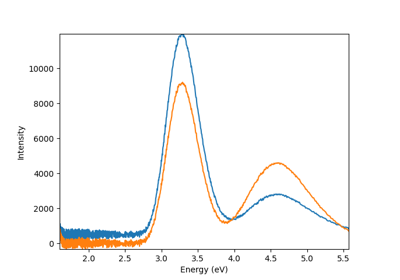
plot_spectra(), plot_images() and
plot_signals().
Unlike the plot(), these functions
can plot multiple signal together and can be useful to compose figure
comparing signals, etc.