Note
Go to the end to download the full example code.
Create Map from ROI in signal space#
Use the plot_roi_map() function to create interactive maps defined
from ROIs in signal space.
import hyperspy.api as hs
Create a signal:
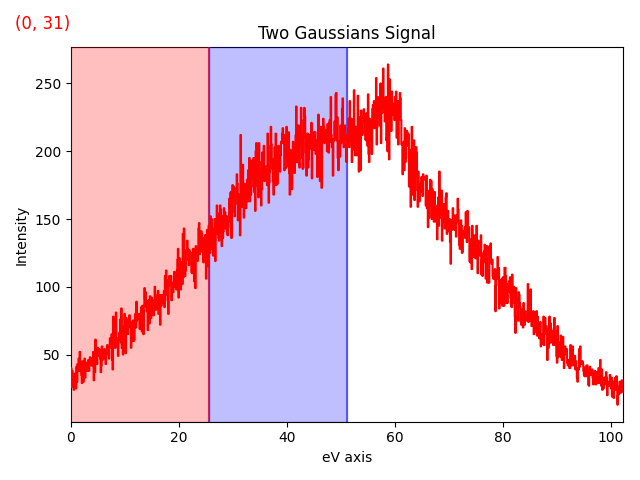
s = hs.data.two_gaussians()
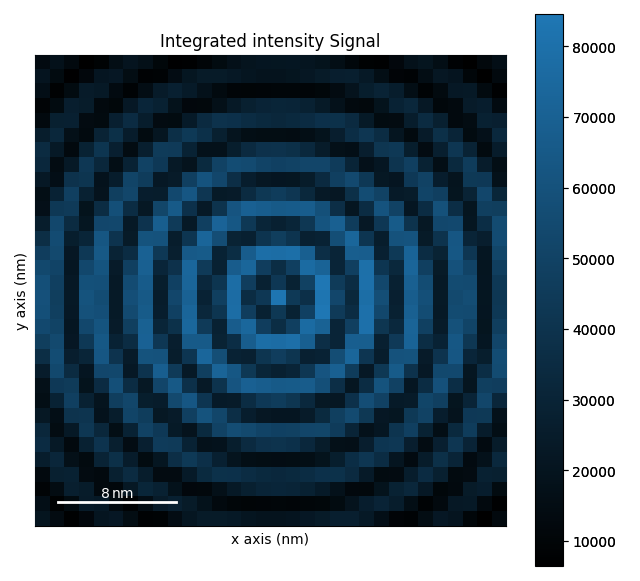
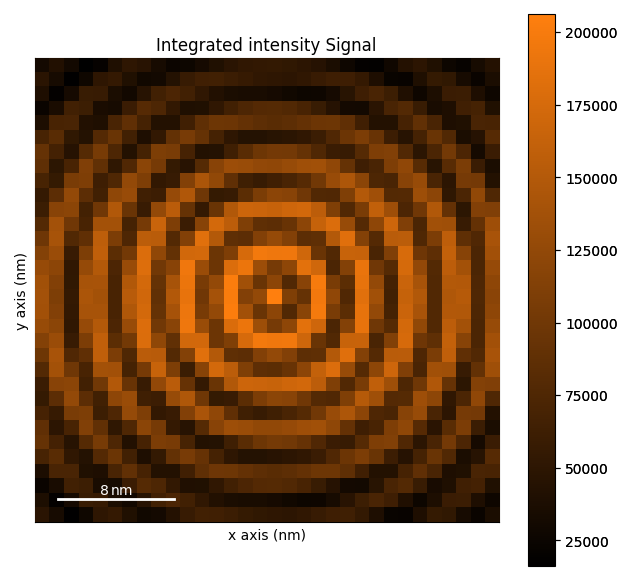
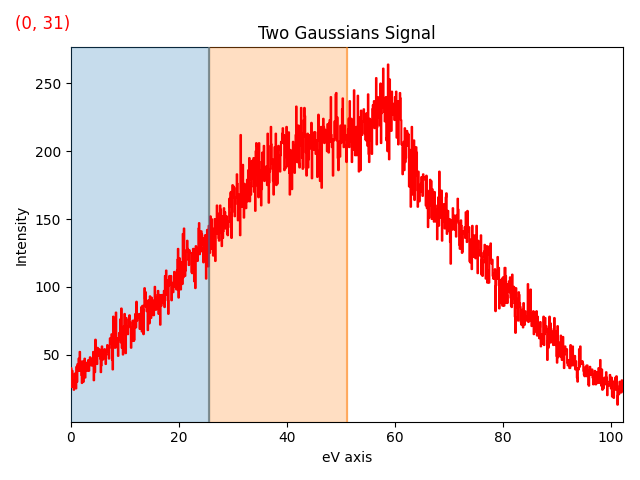
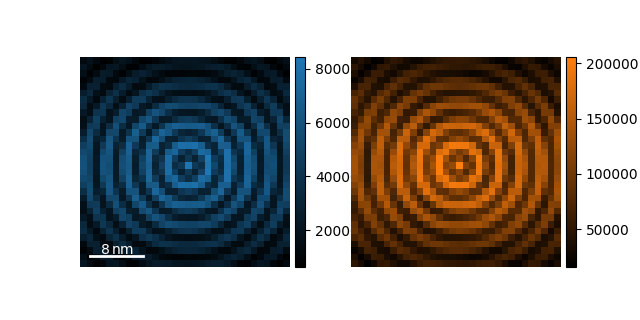
Add 2 ROIs in signal space and map the corresponding signal using plot_roi_map()
The ROIs are added to the plot of the signal:
s.plot()
roi = hs.plot.plot_roi_map(s, rois=2)


Same as above, but plotting the maps in a single figure:
s.plot()
roi = hs.plot.plot_roi_map(s, rois=2, single_figure=True)
# Choose this figure as gallery thumbnail:
# sphinx_gallery_thumbnail_number = 7
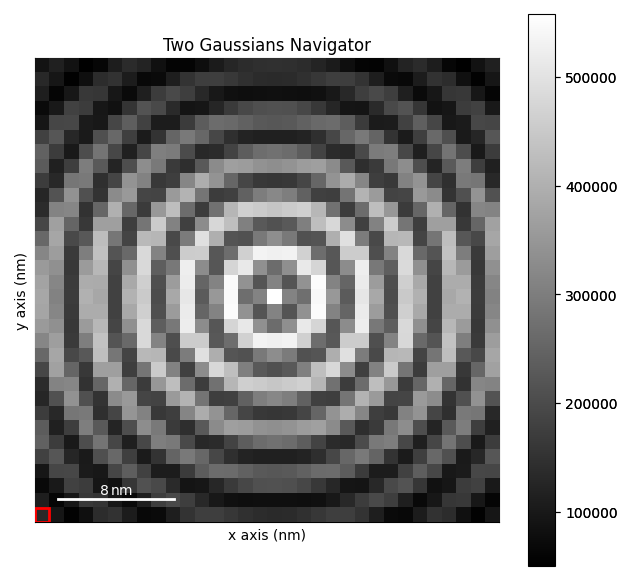
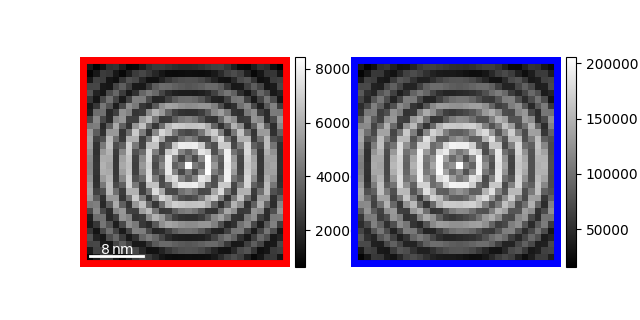
Same as in previous step, but additionally specifying cmap and colors:
s.plot()
roi = hs.plot.plot_roi_map(s, rois=2, color=["r", "b"], cmap="gray", single_figure=True)

Total running time of the script: (0 minutes 4.540 seconds)