Note
Go to the end to download the full example code.
Create Map from CircleROI in signal space#
Use the plot_roi_map() function to create interactive maps defined
from a CircleROI in signal space.
import hyperspy.api as hs
import numpy as np
Create a signal:
rng = np.random.default_rng(0)
data = rng.random(size=(100, 100, 50, 50))
s = hs.signals.Signal2D(data)
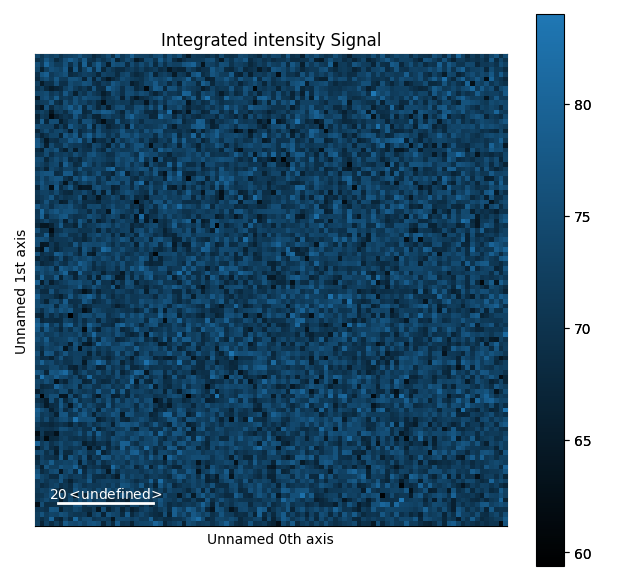
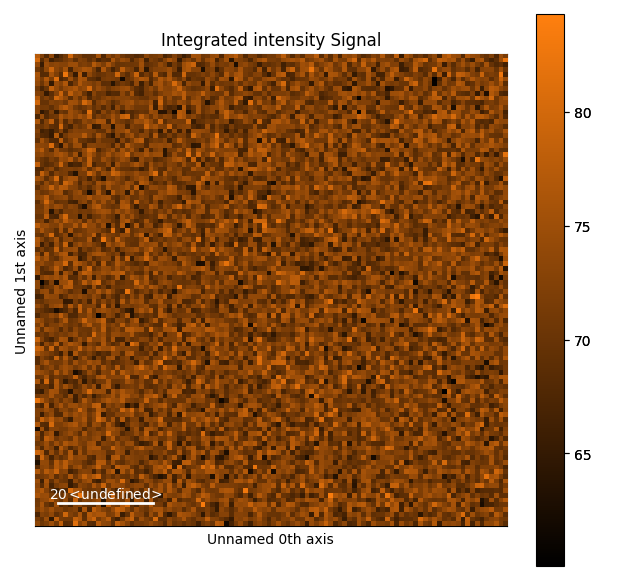
Add 2 ROIs in signal space and map the corresponding signal using plot_roi_map().
The ROIs are added to the plot of the signal and by default a
RectangularROI is used
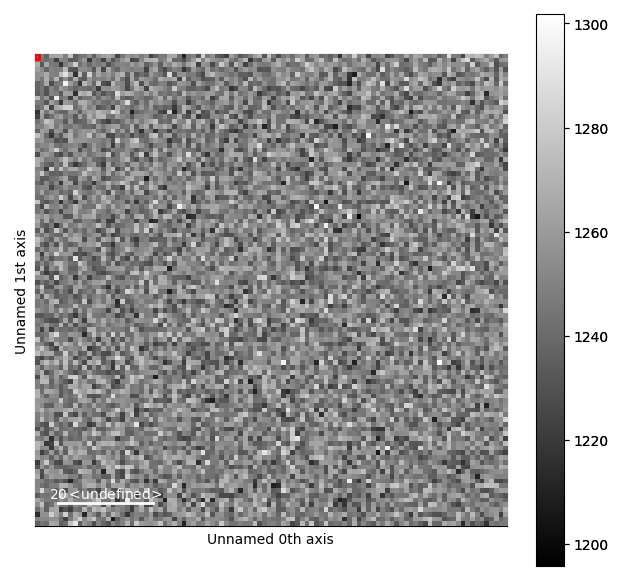
s.plot()
roi = hs.plot.plot_roi_map(s, rois=2)
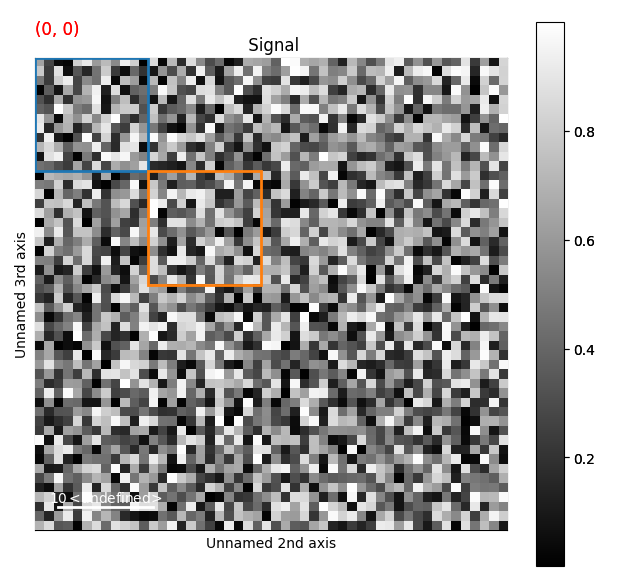
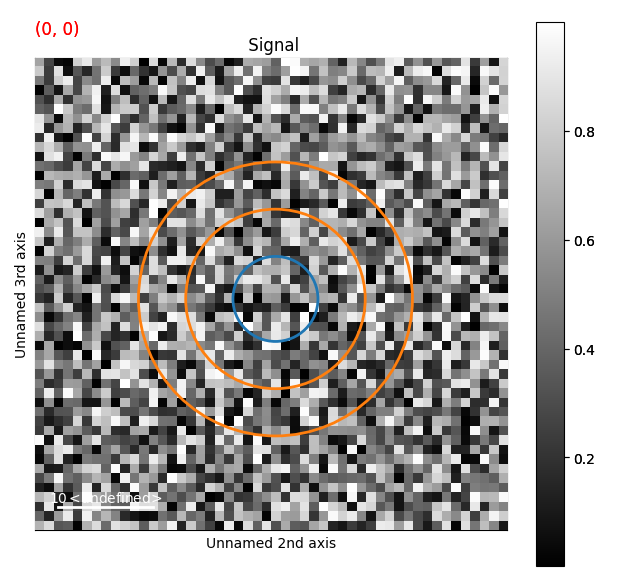
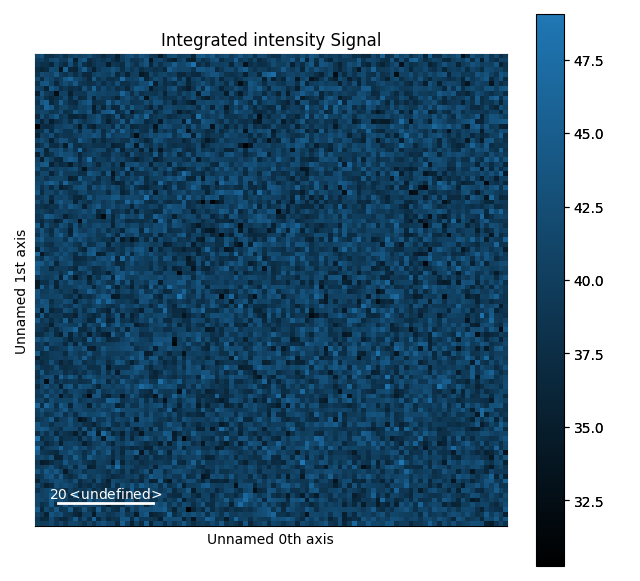
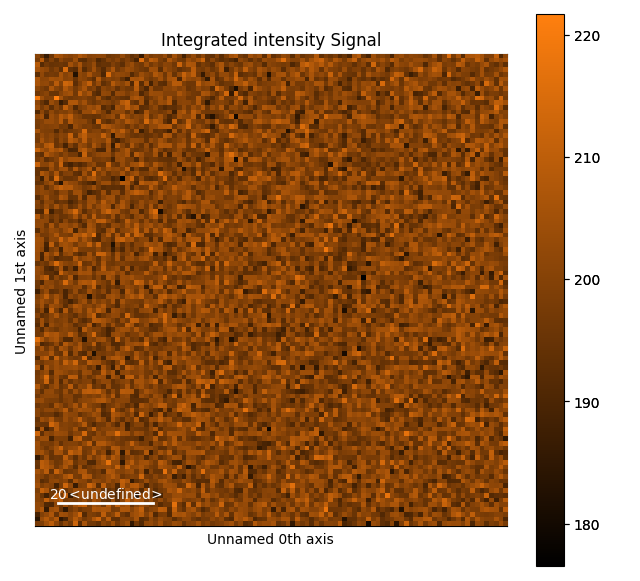
Same as above but with using CircleROI with predefined position:
roi1 = hs.roi.CircleROI(cx=25, cy=25, r=5)
roi2 = hs.roi.CircleROI(cx=25, cy=25, r=15, r_inner=10)
s.plot()
roi = hs.plot.plot_roi_map(s, rois=[roi1, roi2])
# Choose this figure as gallery thumbnail:
# sphinx_gallery_thumbnail_number = 6

Total running time of the script: (0 minutes 4.078 seconds)