Ctrl+K
HyperSpy API has changed in version 2.0, see the release notes!

HyperSpy

  • User Guide
  • Examples
  • Reference
  • Get Help
  • Release Notes
  • Contribute
  • Tutorial
  • GitHub
  • Gitter
  • HyperSpy
  • User Guide
  • Examples
  • Reference
  • Get Help
  • Release Notes
  • Contribute
  • Tutorial
  • GitHub
  • Gitter
  • HyperSpy

Section Navigation

  • Markers
    • Ragged Points
    • Arrow markers
    • Vertical Line Markers
    • Circle Markers with Radius Dependent Coloring
    • Text Markers
    • Line Markers
    • Varying number of arrows per navigation position
    • Circle Markers
    • Filled Circle Markers
    • Rotation of markers
    • Add/Remove items from existing Markers
    • Polygon Markers
    • Ellipse markers
    • Square Markers
    • Star Markers
    • Rectangle Markers
    • Arrow markers
    • Creating Markers from a signal
    • Making Inset Images
    • Transforms and Units
  • Signal Creation
    • Creates a signal1D from a text file
    • Creates a line spectrum
    • Creates a signal1D from tabular data
    • Creates a 3D image
    • Creates a spectrum image
    • Creates a 4D image
  • Data Visualization
    • Composing Figure
    • Specifying Matplotlib Axis
  • Extensions
    • Component convolution
    • Implementation of a model supporting convolution of components
  • Loading, saving and exporting
    • Export single spectrum
    • Adjust contrast and save RGB images
  • Model fitting
    • Plot Residual
    • Simple arctan fit
  • Making Custom Layouts for Plots
    • Creating Custom Layouts
    • ROI Insets
  • Processing
    • Baseline Removal
  • Region of Interest
    • SpanROI on signal axis
    • Create Map from ROI in signal space
    • PolygonROI
    • Navigator ROI
    • Create Map from CircleROI in signal space
    • Live FFT
    • Combine PolygonROI
    • Extract line profile from image interactively
    • Interactive integration of one dimensional signal
  • Simple simulations
    • Simple simulation (2 Gaussians)
  • Gallery of Examples
  • Region of Interest
  • Navigator ROI

Note

Go to the end to download the full example code.
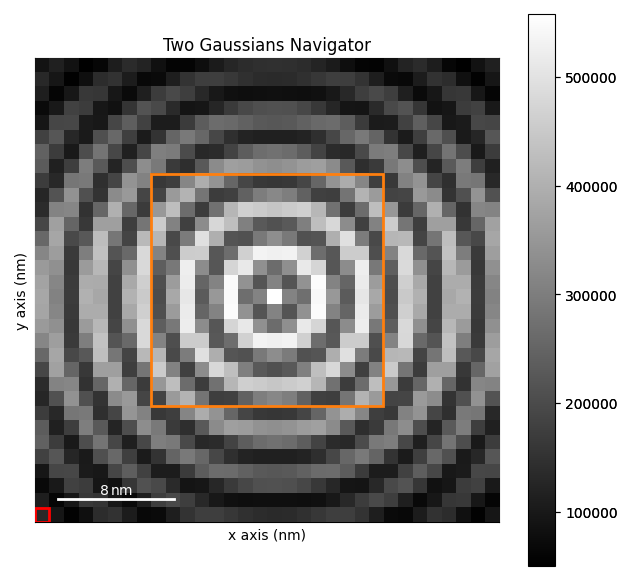
Navigator ROI#

Use a RectangularROI to take the sum of an area of the navigation space.

import hyperspy.api as hs

Create a signal:

s = hs.data.two_gaussians()

Create the roi, here a RectangularROI for the two dimension navigation space:

roi = hs.roi.RectangularROI()

Slice signal with roi with the ROI. By using the interactive function, the output signal s_roi will update automatically. The ROI will be added automatically on the signal figure.

By default, the ROI will be added to the navigation or signal. We specify recompute_out_event=None to avoid redundant computation when changing the ROI

s.plot()
s_roi = roi.interactive(s, recompute_out_event=None, color='C1')

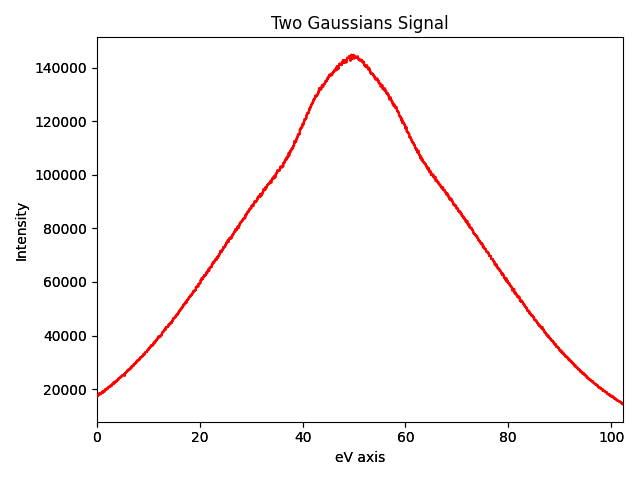
# We use :py:class:`~.interactive` function to compute the sum over the ROI interactively:

roi_sum = hs.interactive(s_roi.sum, recompute_out_event=None)

# Choose the second figure as gallery thumbnail:
# sphinx_gallery_thumbnail_number = 1
  • Two Gaussians Navigator
  • Two Gaussians Signal

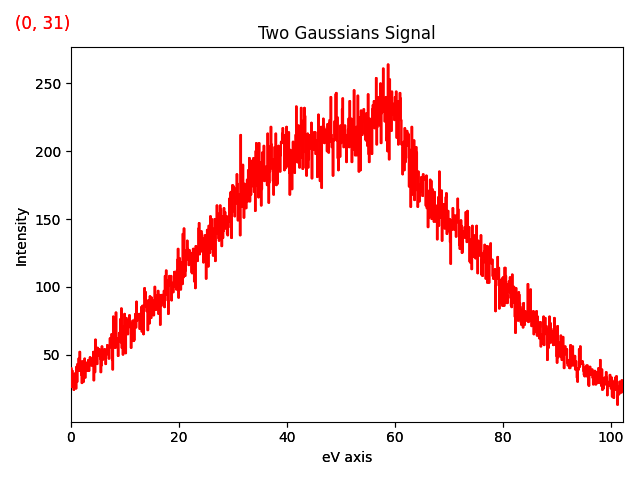
Plot the signal sliced by the ROI:

roi_sum.plot()
Two Gaussians Signal

Total running time of the script: (0 minutes 1.374 seconds)

Download Jupyter notebook: ROI_navigator.ipynb

Download Python source code: ROI_navigator.py

Download zipped: ROI_navigator.zip

Gallery generated by Sphinx-Gallery

previous

PolygonROI

next

Create Map from CircleROI in signal space

This Page

  • Show Source

© Copyright 2011-2025, The HyperSpy development team.

Created using Sphinx 8.2.1.

Built with the PyData Sphinx Theme 0.16.1.