Note
Go to the end to download the full example code.
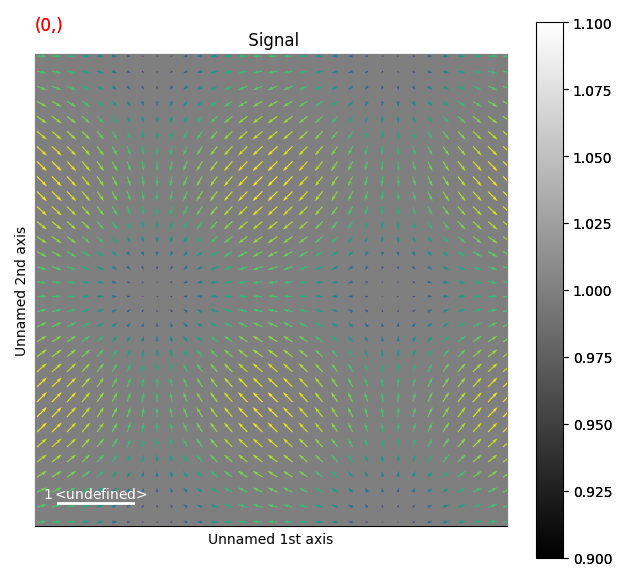
Arrow markers#
Create a signal
import hyperspy.api as hs
import numpy as np

# Create a Signal2D with 2 navigation dimensions
rng = np.random.default_rng(0)
data = np.ones((50, 100, 100))
s = hs.signals.Signal2D(data)

for axis in s.axes_manager.signal_axes:
    axis.scale = 2*np.pi / 100
This example shows how to draw arrows
# Define the position of the arrows
X, Y = np.meshgrid(np.arange(0, 2 * np.pi, .2), np.arange(0, 2 * np.pi, .2))
offsets = np.column_stack((X.ravel(), Y.ravel()))
U = np.cos(X).ravel() / 7.5
V = np.sin(Y).ravel() / 7.5
C = np.hypot(U, V)

m = hs.plot.markers.Arrows(offsets, U, V, C=C)
s.plot()
s.add_marker(m)
sphinx_gallery_thumbnail_number = 2
Total running time of the script: (0 minutes 0.937 seconds)