Note
Go to the end to download the full example code.
Line Markers#
Create a signal
import hyperspy.api as hs
import matplotlib.pyplot as plt
import numpy as np

# Create a Signal2D with 2 navigation dimensions
rng = np.random.default_rng(0)
data = np.ones((25, 25, 100, 100))
s = hs.signals.Signal2D(data)
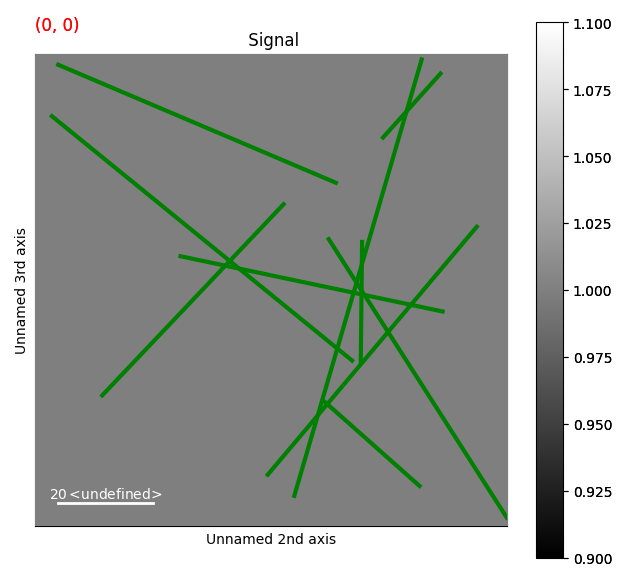
This first example shows how to draw static stars markers using the matplotlib StarPolygonCollection
# Define the position of the lines
# line0: (x0, y0), (x1, y1)
# line1: (x0, y0), (x1, y1)
# ...

segments = rng.random((10, 2, 2)) * 100

m = hs.plot.markers.Lines(
    segments=segments,
    linewidth=3,
    colors='g',
    )

s.plot()
s.add_marker(m)

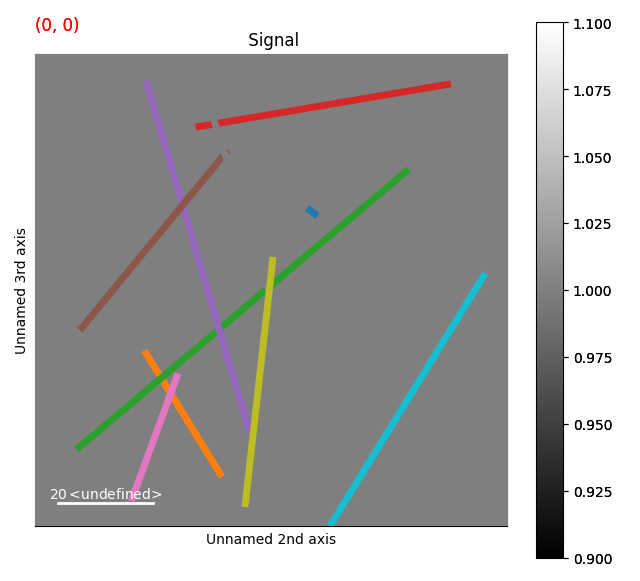
Dynamic Line Markers#
This first example shows how to draw dynamic lines markers, whose position depends on the navigation coordinates
segments = np.empty(s.axes_manager.navigation_shape, dtype=object)
for ind in np.ndindex(segments.shape):
    segments[ind] = rng.random((10, 2, 2)) * 100

# Get list of colors
colors = list(plt.rcParams['axes.prop_cycle'].by_key()['color'])

m = hs.plot.markers.Lines(
    segments=segments,
    colors=colors,
    linewidth=5,
    )

s.plot()
s.add_marker(m)
sphinx_gallery_thumbnail_number = 2
Total running time of the script: (0 minutes 1.990 seconds)