Note
Go to the end to download the full example code.
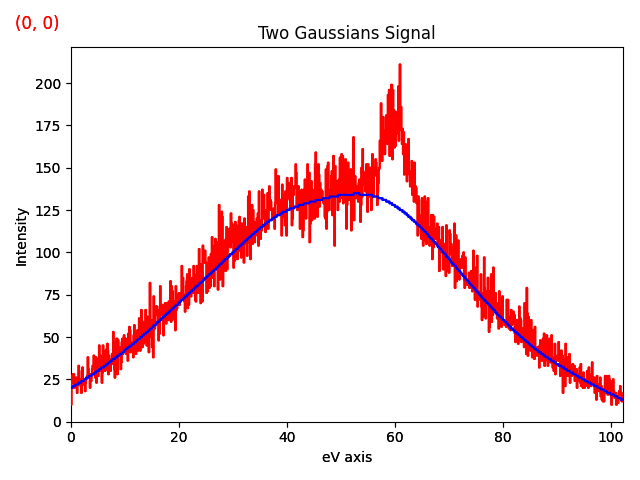
Baseline Removal#
This example shows how to remove a baseline from a 1D signal using the pybaselines library.
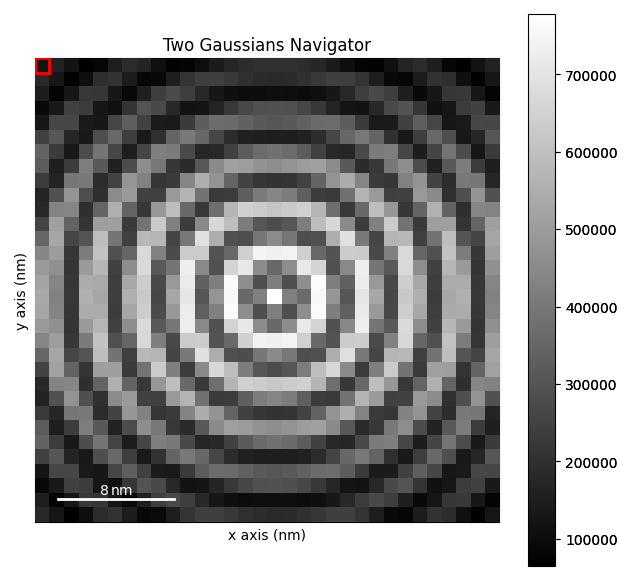
Create a signal
import hyperspy.api as hs
s = hs.data.two_gaussians()
Remove baseline using remove_baseline():
s2 = s.remove_baseline(method="aspls", lam=1E7, inplace=False)
  0%|          | 0/51 [00:00<?, ?it/s]
  2%|▏         | 1/51 [00:04<03:56,  4.72s/it]
 25%|██▌       | 13/51 [00:05<00:12,  3.09it/s]
 29%|██▉       | 15/51 [00:06<00:12,  3.00it/s]
 53%|█████▎    | 27/51 [00:06<00:03,  7.14it/s]
100%|██████████| 51/51 [00:06<00:00,  7.80it/s]
Plot the signal and its baseline:
(s + (s-s2) * 1j).plot()
# Choose the second figure as gallery thumbnail:
# sphinx_gallery_thumbnail_number = 2
Total running time of the script: (0 minutes 7.939 seconds)