Note
Go to the end to download the full example code.
Interactive integration of one dimensional signal#
This example shows how to integrate a signal using an interactive ROI.
import hyperspy.api as hs
Create a signal:
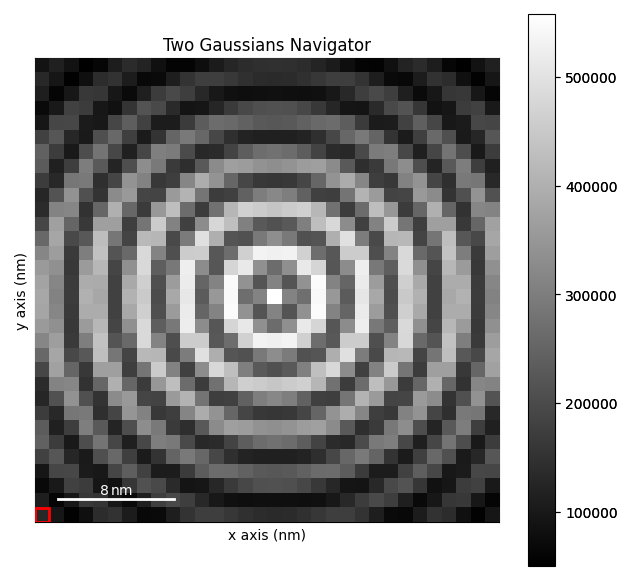
s = hs.data.two_gaussians()
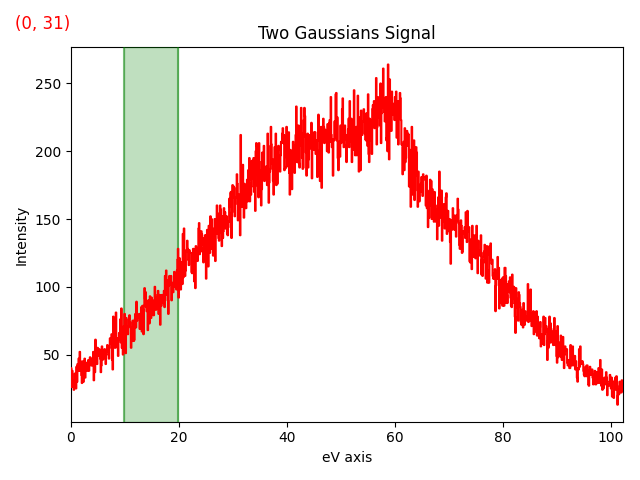
Create SpanROI:
roi = hs.roi.SpanROI(left=10, right=20)
Slice signal with roi with the ROI. By using the interactive()
function, the output signal s_roi will update automatically.
The ROI will be added automatically on the signal figure:
s.plot()
sliced_signal = roi.interactive(s, axes=s.axes_manager.signal_axes)
# Choose the second figure as gallery thumbnail:
# sphinx_gallery_thumbnail_number = 2
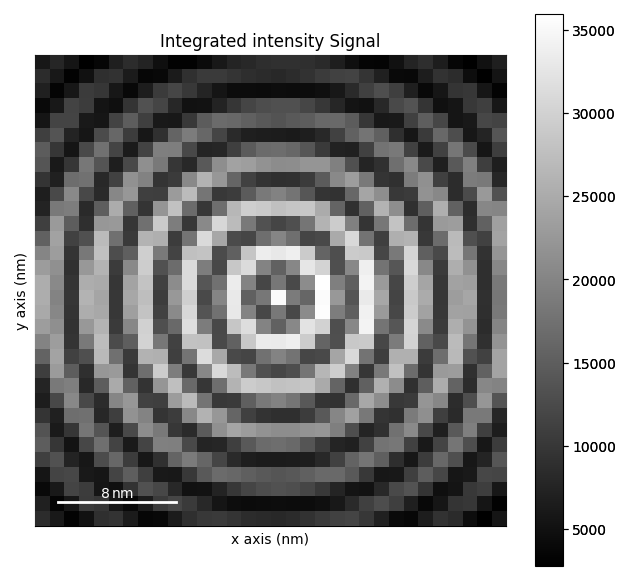
Create a placeholder signal for the integrated signal and set metadata:
integrated_sliced_signal = sliced_signal.sum(axis=-1).T
integrated_sliced_signal.metadata.General.title = "Integrated intensity"
Create the interactive computation, which will update when the ROI roi is
changed. wWe use the out argument to place the results of the integration
in the placeholder signal defined in the previous step:
hs.interactive(
    sliced_signal.sum,
    axis=sliced_signal.axes_manager.signal_axes,
    event=roi.events.changed,
    recompute_out_event=None,
    out=integrated_sliced_signal,
)
<Signal2D, title: Integrated intensity, dimensions: (|32, 32)>
Plot the integrated sum signal:
integrated_sliced_signal.plot()
Total running time of the script: (0 minutes 1.385 seconds)