Note
Go to the end to download the full example code.
ROI Insets#
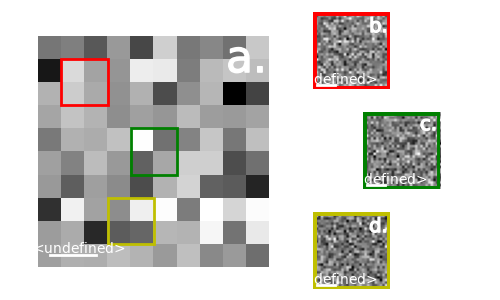
ROI’s can be powerful tools to help visualize data. In this case we will define ROI’s in hyperspy, sum
the data within the ROI, and then plot the sum as a signal. Using the matplotlib.figure.SubFigure class
we can create a custom layout to visualize and interact with the data.
Note
Plotting data with subfigures is slower than using separates figures.
We can connect these ROI’s using the hyperspy.api.interactive() function which allows us to move the ROI’s and see the sum of the underlying data.

import matplotlib.pyplot as plt
import hyperspy.api as hs
import numpy as np

rng = np.random.default_rng()

fig = plt.figure(figsize=(5, 3))
gs = fig.add_gridspec(6, 10)
sub1 = fig.add_subfigure(gs[0:6, 0:6])
sub2 = fig.add_subfigure(gs[0:2, 6:8])
sub3 = fig.add_subfigure(gs[2:4, 7:9])
sub4 = fig.add_subfigure(gs[4:6, 6:8])


s = hs.signals.Signal2D(rng.random((10, 10, 30, 30)))
r1 = hs.roi.RectangularROI(1, 1, 3, 3)
r2 = hs.roi.RectangularROI(4, 4, 6, 6)
r3 = hs.roi.RectangularROI(3, 7, 5, 9)

navigator = s.sum(axis=(2, 3)).T  # create a navigator signal
navigator.plot(fig=sub1, colorbar=False, axes_off=True, title="", plot_indices=False)


s2 = r1.interactive(s, navigation_signal=navigator, color="red")
s3 = r2.interactive(s, navigation_signal=navigator, color="g")
s4 = r3.interactive(s, navigation_signal=navigator, color="y")

s2_int = s2.sum()
s3_int = s3.sum()
s4_int = s4.sum()

s2_int.plot(fig=sub2, colorbar=False, axes_off=True, title="", plot_indices=False)
s3_int.plot(fig=sub3, colorbar=False, axes_off=True, title="", plot_indices=False)
s4_int.plot(fig=sub4, colorbar=False, axes_off=True, title="", plot_indices=False)

# Connect ROIS
for s, s_int, roi in zip([s2, s3, s4], [s2_int, s3_int, s4_int],[r1,r2,r3]):
    hs.interactive(
        s.sum,
        event=roi.events.changed,
        recompute_out_event=None,
        out=s_int,
    )

# Add Borders to the match the color of the ROI

for signal,color, label  in zip([s2_int, s3_int, s4_int], ["r", "g", "y"], ["b.", "c.", "d."]):
    edge =  hs.plot.markers.Squares(
    offset_transform="axes",
    offsets=(0.5, 0.5),
    units="width",
    widths=1,
    color=color,
    linewidth=5,
    facecolor="none",
    )

    signal.add_marker(edge)

    label = hs.plot.markers.Texts(
    texts=(label,), offsets=[[0.85, 0.85]], offset_transform="axes", sizes=2, color="w"
    )
    signal.add_marker(label)

# Label the big plot

label = hs.plot.markers.Texts(
    texts=("a.",), offsets=[[0.9, 0.9]], offset_transform="axes", sizes=10, color="w"
    )
navigator.add_marker(label)
Total running time of the script: (0 minutes 0.409 seconds)
