Note
Go to the end to download the full example code.
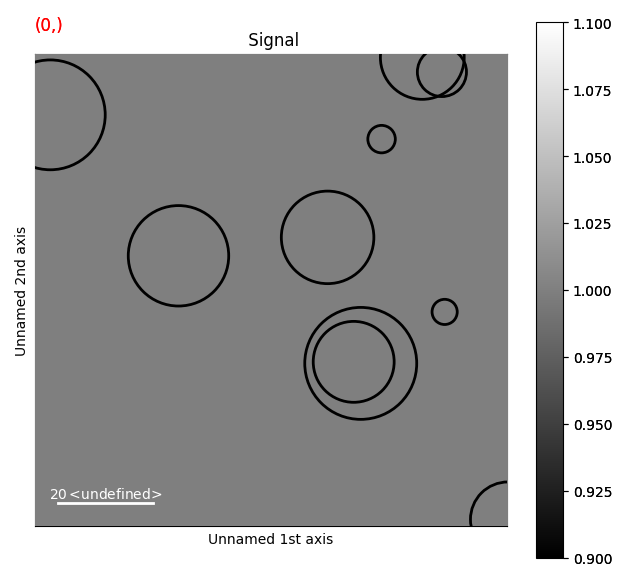
Circle Markers with Radius Dependent Coloring#
This example shows how to draw circle with the color of the circle scaling with the radius of the circle
Create a signal
import hyperspy.api as hs
import matplotlib.pyplot as plt
import numpy as np

# Create a Signal2D
rng = np.random.default_rng(0)
s = hs.signals.Signal2D(np.ones((25, 100, 100)))
This first example shows how to draw arrows
# Define the size of the circles
sizes = rng.random((10, )) * 20 + 5

# Define the position of the circles
offsets = rng.random((10, 2)) * 100

m = hs.plot.markers.Circles(
    sizes=sizes,
    offsets=offsets,
    linewidth=2,
    )

s.plot()
s.add_marker(m)
Note
Any changes to the marker made by setting matplotlib.collections.Collection
attributes will not be saved when saving as hspy/zspy file.
# Set the color of the circles
m.set_ScalarMappable_array(sizes.ravel() / 2)

# Add corresponding colorbar
cbar = m.plot_colorbar()
cbar.set_label('Circle radius')

# Set animated state of colorbar to support blitting
animated = plt.gcf().canvas.supports_blit
cbar.ax.yaxis.set_animated(animated)
cbar.solids.set_animated(animated)

sphinx_gallery_thumbnail_number =
Total running time of the script: (0 minutes 0.762 seconds)