Note
Go to the end to download the full example code.
Transforms and Units#
This example shows how to use both the offset_transform and `transforms
parameters for markers
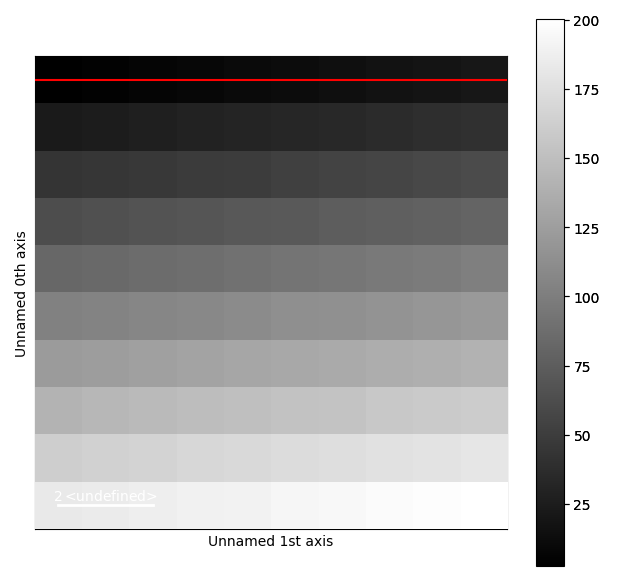
Create a signal
import hyperspy.api as hs
import numpy as np

rng = np.random.default_rng()
data = np.arange(1, 101).reshape(10, 10)*2 + rng.random((10, 10))
signal = hs.signals.Signal1D(data)
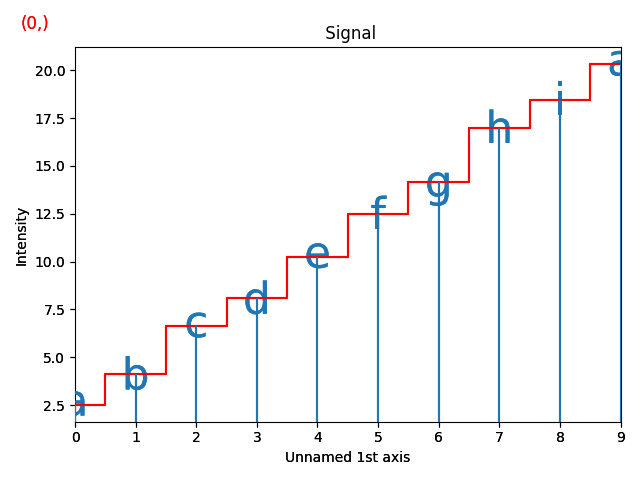
The first example shows how to draw markers which are relative to some 1D signal. This is how the EDS and EELS Lines are implemented in the exspy package.
segments = np.zeros((10, 2, 2)) # line segemnts for realative markers
segments[:, 1, 1] = 1  # set y values end (1 means to the signal curve)
segments[:, 0, 0] = np.arange(10).reshape(10)  # set x for line start
segments[:, 1, 0] = np.arange(10).reshape(10)  # set x for line stop

offsets = np.zeros((10,2)) # offsets for texts positions
offsets[:, 1] = 1  # set y value for text position ((1 means to the signal curve))
offsets[:, 0] = np.arange(10).reshape(10)  # set x for line start

markers = hs.plot.markers.Lines(segments=segments,transform="relative")
texts = hs.plot.markers.Texts(offsets=offsets,
                              texts=["a", "b", "c", "d", "e", "f", "g", "h", "i"],
                              sizes=10,
                              offset_transform="relative",
                              shift=0.005)  # shift in axes units for some constant displacement
signal.plot()
signal.add_marker(markers)
signal.add_marker(texts)

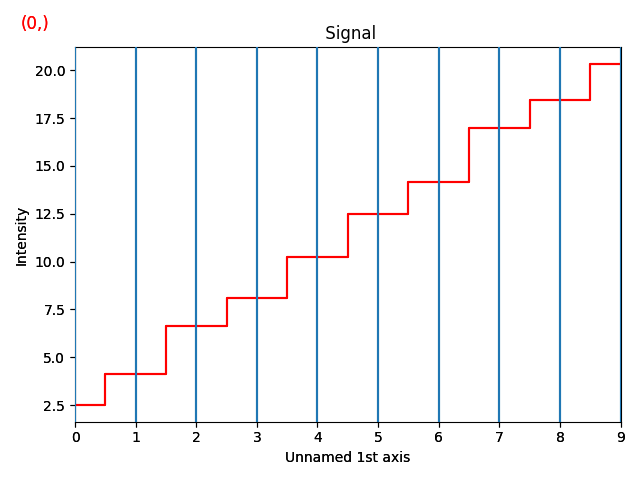
The second example shows how to draw markers which extend to the edges of the axes. This is how the VerticalLines and HorizontalLines markers are implemented.
markers = hs.plot.markers.Lines(segments=segments,
                                transform="xaxis")


signal.plot()
signal.add_marker(markers)

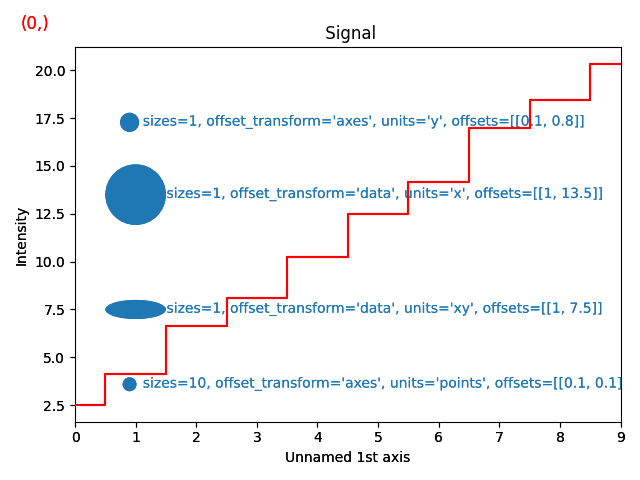
The third example shows how an offset_transform of 'axes' can be
used to annotate a signal.
The size of the marker is specified in units defined by the transform,
in this case "xaxis_scale", "yaxis_scale" or "display"
offsets = [[1, 13.5], ]  # offsets for positions
sizes =1
units = 'x'
offset_transform = 'data'
string = (f"       sizes={sizes}, offset_transform='{offset_transform}', units='{units}', offsets={offsets}",)

marker1text = hs.plot.markers.Texts(offsets=offsets,
                                    texts=string,
                                    sizes=1,
                                    horizontalalignment="left",
                                    verticalalignment="baseline",
                                    offset_transform=offset_transform)

marker = hs.plot.markers.Points(offsets=offsets,
                      sizes=sizes, units=units, offset_transform=offset_transform)


offsets = [[.1, .1], ]  # offsets for positions
sizes =10
units = 'points'
offset_transform = 'axes'
string = (f"   sizes={sizes}, offset_transform='{offset_transform}', units='{units}', offsets={offsets}",)

marker2text = hs.plot.markers.Texts(offsets=offsets,
                                    texts=string,
                                    sizes=1,
                                    horizontalalignment="left",
                                    verticalalignment="baseline",
                                    offset_transform=offset_transform)

marker2 = hs.plot.markers.Points(offsets=offsets,
                      sizes=sizes, units=units, offset_transform=offset_transform)


offsets = [[.1, .8], ]  # offsets for positions
sizes =1
units = 'y'
offset_transform = 'axes'
string = (f"   sizes={sizes}, offset_transform='{offset_transform}', units='{units}', offsets={offsets}",)

marker3text = hs.plot.markers.Texts(offsets=offsets,
                                    texts=string,
                                    sizes=1,
                                    horizontalalignment="left",
                                    verticalalignment="baseline",
                                    offset_transform=offset_transform)

marker3 = hs.plot.markers.Points(offsets=offsets,
                      sizes=sizes, units=units, offset_transform=offset_transform)


offsets = [[1, 7.5], ]  # offsets for positions
sizes =1
units = 'xy'
offset_transform = 'data'
string = (f"       sizes={sizes}, offset_transform='{offset_transform}', units='{units}', offsets={offsets}",)

marker4text = hs.plot.markers.Texts(offsets=offsets,
                                    texts=string,
                                    sizes=1,
                                    horizontalalignment="left",
                                    verticalalignment="baseline",
                                    offset_transform=offset_transform)

marker4 = hs.plot.markers.Points(offsets=offsets,
                      sizes=sizes, units=units, offset_transform=offset_transform)


signal.plot()
signal.add_marker(marker)
signal.add_marker(marker1text)
signal.add_marker(marker2)
signal.add_marker(marker2text)
signal.add_marker(marker3)
signal.add_marker(marker3text)
signal.add_marker(marker4)
signal.add_marker(marker4text)
sphinx_gallery_thumbnail_number = 2
Total running time of the script: (0 minutes 6.147 seconds)