Note
Go to the end to download the full example code.
Signal normalisation#
import hyperspy.api as hs
import numpy as np
Default normalisation#
Create two unique Signal1D for example
s = hs.data.luminescence_signal()

s_shifted = np.roll(s.data, 200)
s_shifted = hs.signals.Signal1D(s_shifted)

s1 = (s/0.8 + hs.signals.Signal1D(s_shifted/4)) + 500
s2 = s + hs.signals.Signal1D(s_shifted/2)
Plot un-normalised signals
hs.plot.plot_spectra([s1,s2])
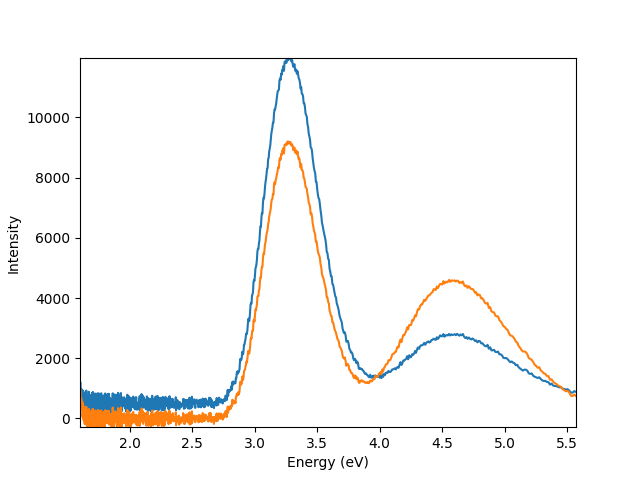
<Axes: xlabel='Energy (eV)', ylabel='Intensity'>
Plot both signals with default normalisation, of min and max intensity values to 0 and 1
hs.plot.plot_spectra([s1, s2], normalise = True)
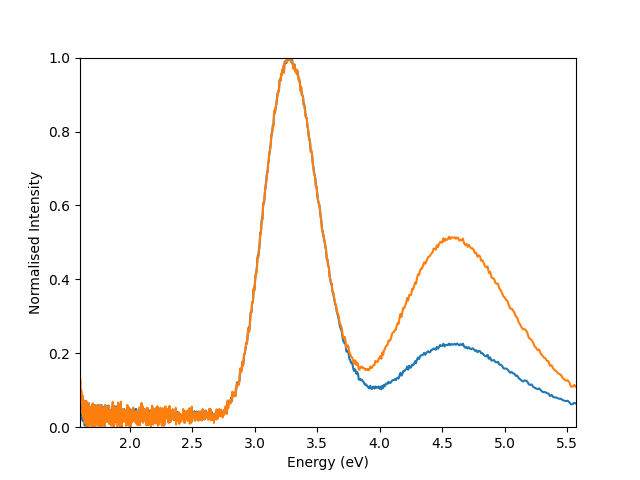
<Axes: xlabel='Energy (eV)', ylabel='Normalised Intensity'>
Normalising to signal range#
In the case that we want to normalise our signals to the background noise, we can create a custom normalisation function. The mean intensity over the index range 5 - 100 is specified to normalise the signals to
def normalise_mean_range(signal):
    data = signal.data

    normalise_range = signal.isig[5:100].data

    scale_factor = 1 / normalise_range.mean()

    return data * scale_factor
Plot signals with custom normalisation function passed as parameter
hs.plot.plot_spectra([s1,s2], normalise = normalise_mean_range)
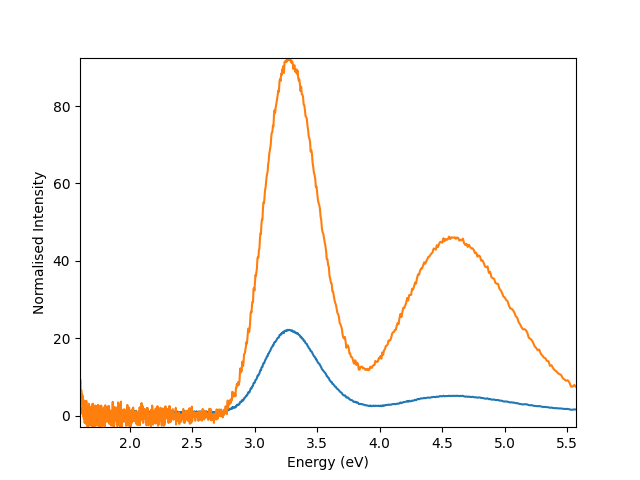
<Axes: xlabel='Energy (eV)', ylabel='Normalised Intensity'>
Normalising to specified signal value#
In the case that we want to normalise our signals to the second weaker peak in our spectra, we adjust our function to normalise the signals to the intensity at energy position 4.5 eV
def normalise_energy_value(signal):
    data = signal.data

    normalise_value = signal.isig[4.5].data

    scale = 1 / normalise_value

    return data * scale
Plot signals with custom normalisation function passed as parameter
hs.plot.plot_spectra([s1,s2], normalise = normalise_energy_value)
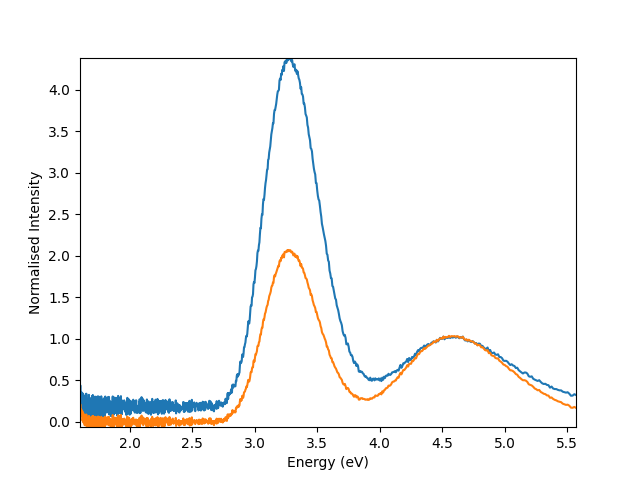
<Axes: xlabel='Energy (eV)', ylabel='Normalised Intensity'>
Total running time of the script: (0 minutes 4.736 seconds)