Note
Go to the end to download the full example code.
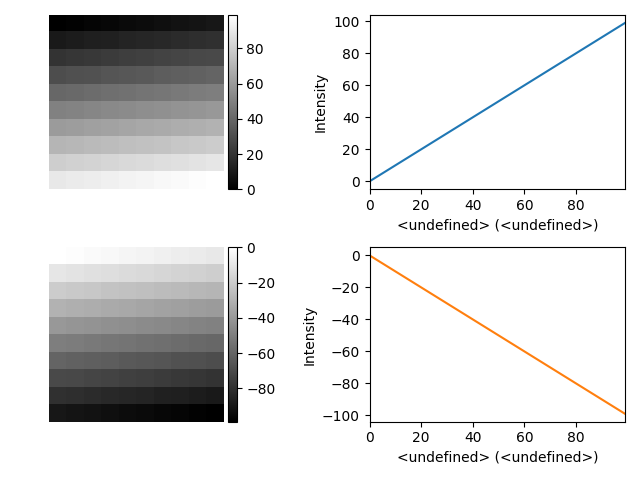
Composing Figure#
This example shows how to compose a figure using
plot_images() and plot_spectra()
import hyperspy.api as hs
import matplotlib.pyplot as plt
import numpy as np
Create the 1D and 2D signals
s2D_0 = hs.signals.Signal2D(np.arange(100).reshape(10, 10))
s2D_1 = -s2D_0

s1D_0 = hs.signals.Signal1D(np.arange(100))
s1D_1 = -s1D_0
Create an array of matplotlib.axis.Axis using matplotlib.pyplot.subplots()
fig, axs = plt.subplots(ncols=2, nrows=2)
hs.plot.plot_images([s2D_0, s2D_1], ax=axs[:, 0], axes_decor="off")
hs.plot.plot_spectra([s1D_0, s1D_1], ax=axs[:, 1], style="mosaic")
array([<Axes: xlabel='<undefined> (<undefined>)', ylabel='Intensity'>,
       <Axes: xlabel='<undefined> (<undefined>)', ylabel='Intensity'>],
      dtype=object)
Total running time of the script: (0 minutes 0.465 seconds)