Note
Go to the end to download the full example code.
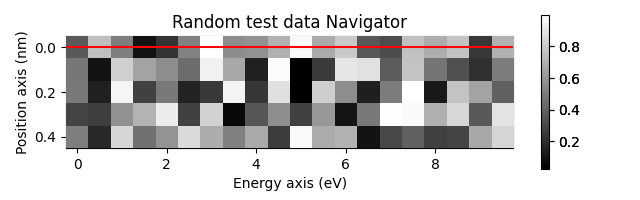
Creates a signal1D from tabular data#
This example creates a signal from tabular data, where the signal axis is given by an array
of data values (the x column) and the tabular data are ordered in columns with 5 columns
containing each 20 values and each column corresponding to a position in the
navigation space (linescan).
import numpy as np
import hyperspy.api as hs
Create a set of tabular data:
x = np.linspace(0, 10, 20)
y = np.random.default_rng().random((20, 5))
Define the axes of the signal and then create the signal:
Convert the non-uniform signal axis to a uniform axis, because non-uniform axes do not support all functionalities of HyperSpy. In this case, the error introduced during conversion to uniform scale is negligeable.
s.axes_manager.signal_axes[0].convert_to_uniform_axis()
Set title of the dataset and label for the data axis:
s.metadata.set_item("General.title", "Random test data")
s.metadata.set_item("Signal.quantity", "Intensity (counts)")
Plot the dataset:
s.plot()
# Choose the second figure as gallery thumbnail:
# sphinx_gallery_thumbnail_number = 2

Total running time of the script: (0 minutes 0.623 seconds)