Note
Go to the end to download the full example code.
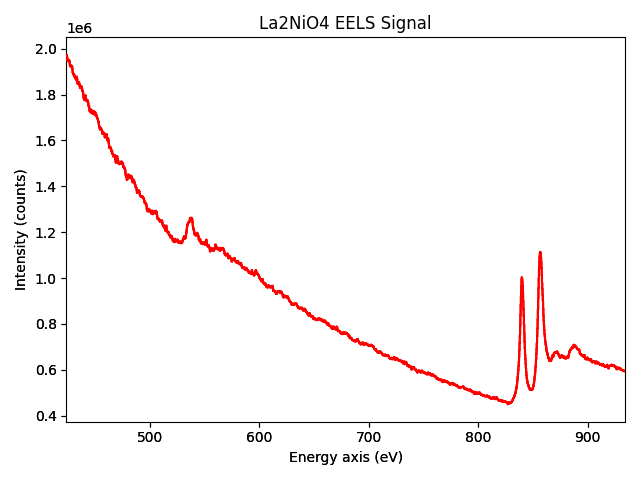
Creates a signal1D from a text file#
This example creates a signal from tabular data imported from a txt file using
numpy.loadtxt(). The signal axis and the EELS intensity values are
given by the first and second columns, respectively.
The tabular data are taken from https://eelsdb.eu/spectra/la2nio4-structure-of-k2nif4/
import numpy as np
import hyperspy.api as hs
Read tabular data from a text file:
x, y = np.loadtxt("La2NiO4_eels.txt", unpack=True)
Define the axes of the signal and then create the signal:
Convert the non-uniform axis to a uniform axis, because non-uniform axes do not support all functionalities of HyperSpy. In this case, the error introduced during conversion to uniform scale is negligeable.
s.axes_manager.signal_axes[0].convert_to_uniform_axis()
Set title of the dataset and label for the data axis:
s.metadata.set_item("General.title", "La2NiO4 EELS")
s.metadata.set_item("Signal.quantity", "Intensity (counts)")
Plot the dataset:
s.plot()
Total running time of the script: (0 minutes 0.445 seconds)