Note
Go to the end to download the full example code.
SpanROI on signal axis#
Use a SpanROI interactively on a Signal1D.
import hyperspy.api as hs
Create a signal:
s = hs.data.two_gaussians()
Create the roi, here a SpanROI for one dimensional ROI:
roi = hs.roi.SpanROI(left=10, right=20)
Slice signal with roi with the ROI. By using the interactive()
function, the output signal s_roi will update automatically.
The ROI will be added automatically on the signal figure.
Specify the axes to add the ROI on either the navigation or signal dimension:
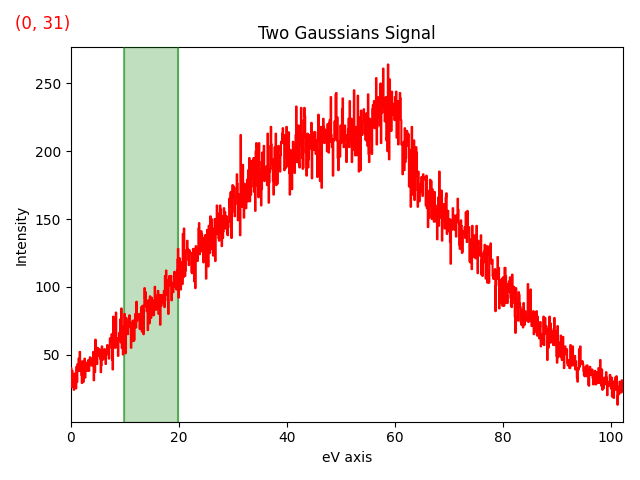
s.plot()
sliced_signal = roi.interactive(s, axes=s.axes_manager.signal_axes)
# Choose the second figure as gallery thumbnail:
# sphinx_gallery_thumbnail_number = 2

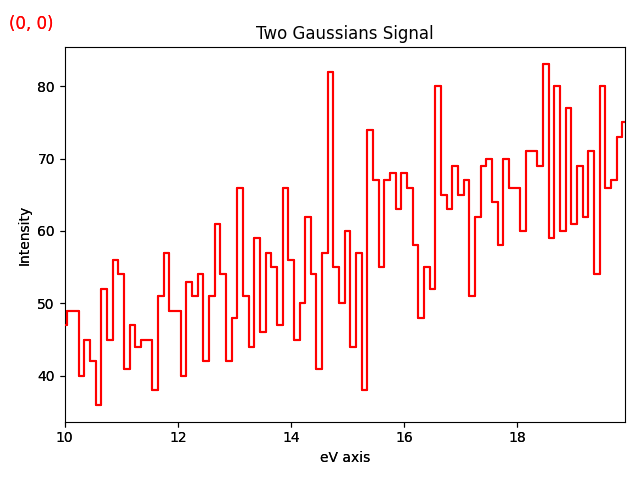
Plot the signal sliced by the ROI and use autoscale='xv' to update the
limits of the plot automatically:
sliced_signal.plot(autoscale='xv')

Total running time of the script: (0 minutes 1.829 seconds)