Note
Go to the end to download the full example code.
Rectangle Markers#
Create a signal
import hyperspy.api as hs
import numpy as np

# Create a Signal2D with 2 navigation dimensions
rng = np.random.default_rng(0)
data = np.ones((25, 25, 100, 100))
s = hs.signals.Signal2D(data)
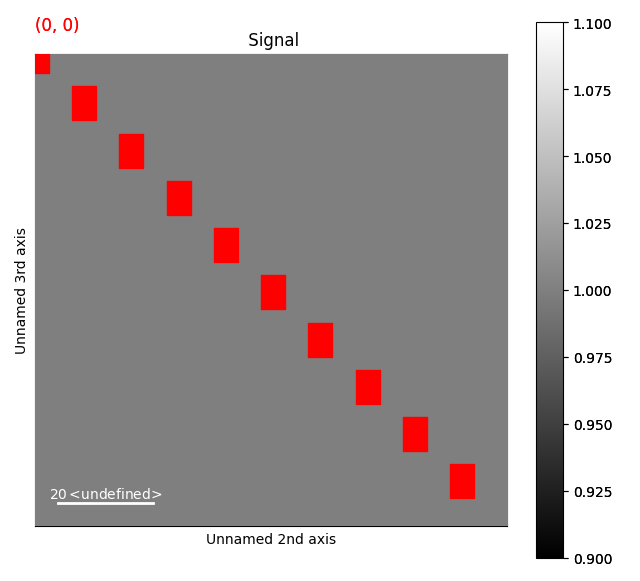
This first example shows how to draw static rectangle markers
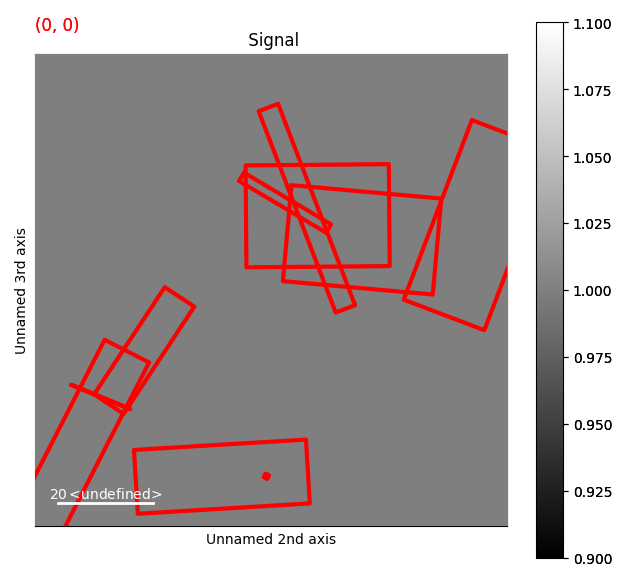
Dynamic Rectangle Markers#
This first example shows how to draw dynamic rectangle markers, whose position, widths, heights and angles depends on the navigation coordinates
s2 = hs.signals.Signal2D(data)

widths = np.empty(s.axes_manager.navigation_shape, dtype=object)
heights = np.empty(s.axes_manager.navigation_shape, dtype=object)
angles = np.empty(s.axes_manager.navigation_shape, dtype=object)
offsets = np.empty(s.axes_manager.navigation_shape, dtype=object)

for index in np.ndindex(offsets.shape):
    widths[index] = rng.random((10, )) * 50
    heights[index] = rng.random((10, )) * 25
    angles[index] = rng.random((10, )) * 180
    offsets[index] = rng.random((10, 2)) * 100

m = hs.plot.markers.Rectangles(
    offsets=offsets,
    widths=widths,
    heights=heights,
    angles=angles,
    color="red",
    facecolor="none",
    linewidth=3
    )


s2.plot()
s2.add_marker(m)

sphinx_gallery_thumbnail_number = 4
Total running time of the script: (0 minutes 1.834 seconds)