Note
Go to the end to download the full example code.
Creating Markers from a signal#
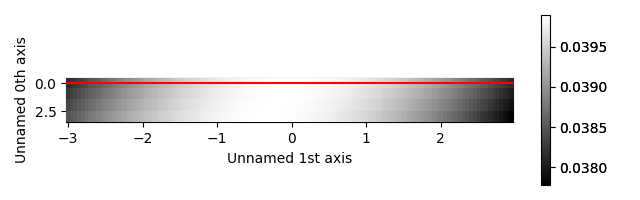
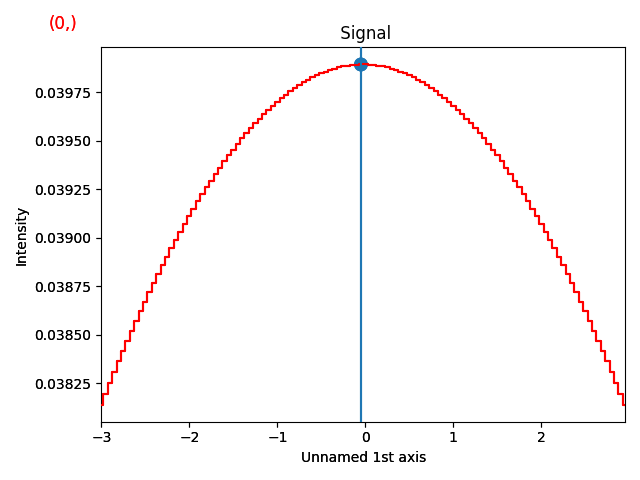
This example shows how to create markers from a signal. This is useful for creating lazy markers from some operation such as peak finding on a signal. Here we show how to create markers from a simple map function which finds the maximum value and plots a marker at that position.
  0%|          | 0/2 [00:00<?, ?it/s][-0.05]
[0.0398941]
[-0.1]
[0.03989411]
[-0.2]
[0.03989412]
[-0.3]
[0.03989413]

100%|██████████| 2/2 [00:00<00:00, 1202.32it/s]

  0%|          | 0/2 [00:00<?, ?it/s]
100%|██████████| 2/2 [00:00<00:00, 3960.63it/s]
import numpy as np
import hyperspy.api as hs


# Making some artificial data
def find_maxima(data, scale, offset):
    ind = np.array(np.unravel_index(np.argmax(data, axis=None), data.shape)).astype(int)
    d = data[ind]
    ind = ind * scale + offset  # convert to physical units
    print(ind)
    print(d)
    return np.array(
        [
            [ind[0], d[0]],
        ]
    )


def find_maxima_lines(data, scale, offset):
    ind = np.array(np.unravel_index(np.argmax(data, axis=None), data.shape)).astype(int)
    ind = ind * scale + offset  # convert to physical units
    return ind


def gaussian(x, mu, sig):
    return (
        1.0 / (np.sqrt(2.0 * np.pi) * sig) * np.exp(-np.power((x - mu) / sig, 2.0) / 2)
    )


data = np.empty((4, 120))
for i in range(4):
    x_values = np.linspace(-3 + i * 0.1, 3 + i * 0.1, 120)
    data[i] = gaussian(x_values, mu=0, sig=10)

s = hs.signals.Signal1D(data)
s.axes_manager.signal_axes[0].scale = 6 / 120
s.axes_manager.signal_axes[0].offset = -3


scale = s.axes_manager.signal_axes[0].scale
offset = s.axes_manager.signal_axes[0].offset
max_values = s.map(find_maxima, scale=scale, offset=offset, inplace=False, ragged=True)
max_values_lines = s.map(
    find_maxima_lines, scale=scale, offset=offset, inplace=False, ragged=True
)

point_markers = hs.plot.markers.Points.from_signal(max_values, signal_axes=None)
line_markers = hs.plot.markers.VerticalLines.from_signal(
    max_values_lines, signal_axes=None
)


s.plot()
s.add_marker(point_markers)
s.add_marker(line_markers)
Total running time of the script: (0 minutes 0.818 seconds)