Note
Go to the end to download the full example code.
Export single spectrum#
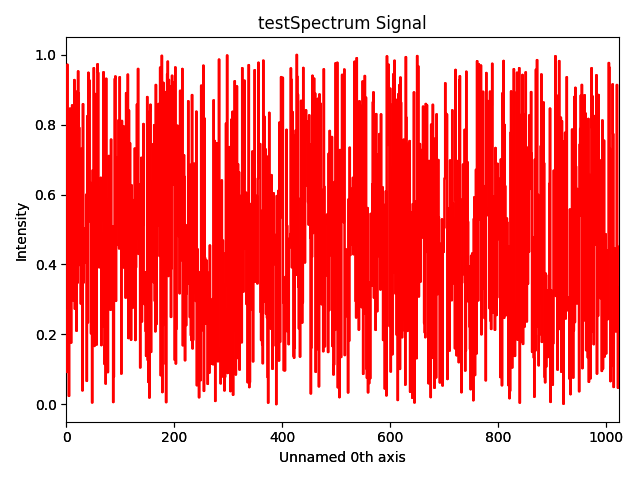
Creates a single spectrum image, saves it and plots it:
Create a single sprectrum using Signal1D signal.
Save signal as a msa file
Plot the signal using the plot method
Save the figure as a png file

# Set the matplotlib backend of your choice, for example
# %matploltib qt
import hyperspy.api as hs
import numpy as np

s = hs.signals.Signal1D(np.random.rand(1024))

# Export as msa file, very similar to a csv file but containing standardised
# metadata
s.save('testSpectrum.msa', overwrite=True)

# Plot it
s.plot()
Total running time of the script: (0 minutes 0.516 seconds)
