Note
Go to the end to download the full example code.
PolygonROI#
Use a PolygonROI interactively on a Signal2D.
import hyperspy.api as hs
Create a signal:
Create the ROI, here a PolygonROI:
roi = hs.roi.PolygonROI()
Initializing the ROI with no arguments puts you directly into constructing the polygon. Do this by clicking where you want the vertices. Click the first vertex to complete the polygon. You can reset the polygon by pressing “Esc” and you can move the entire polygon by shift-clicking and dragging.
An alternative to define the PolygonROI interactively is
to set the vertices of the ROI using the vertices.
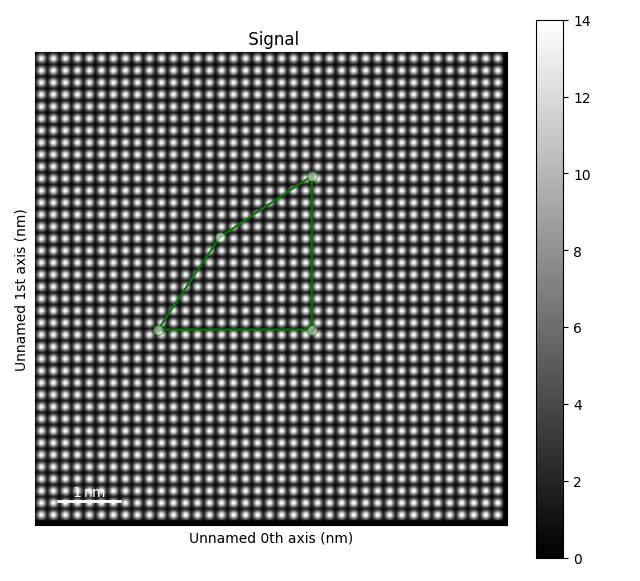
We can use interactive() to add the ROI to the
figure and get the signal from the ROI.
s.plot()
roi.vertices = [(2, 4.5), (4.5, 4.5), (4.5, 2), (3, 3)]
s_roi = roi.interactive(s, axes=s.axes_manager.signal_axes)

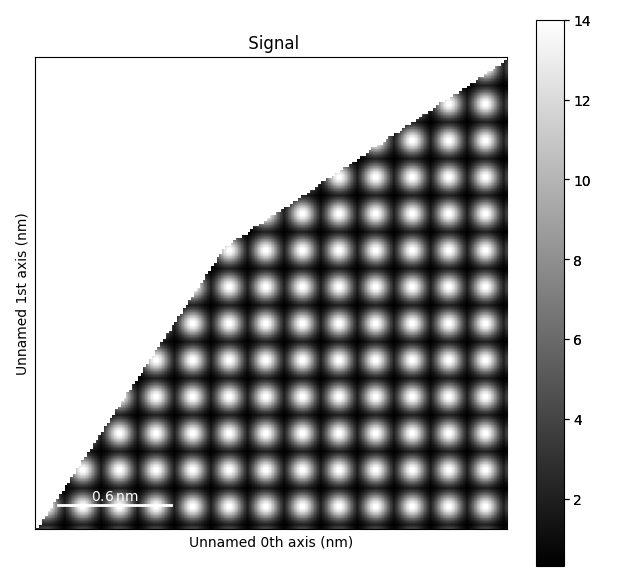
Then we can extract the ROI from the signal and plot it.
s_roi.plot()

The signal will contain a lot of NaNs, so take this into consideration when
doing further processing. E.g. use nanmean()
instead of mean().
mean_value = s_roi.nanmean(axis=(0,1)).data[0]
print("Mean value in ROI:", mean_value)
Mean value in ROI: 5.207270455522169
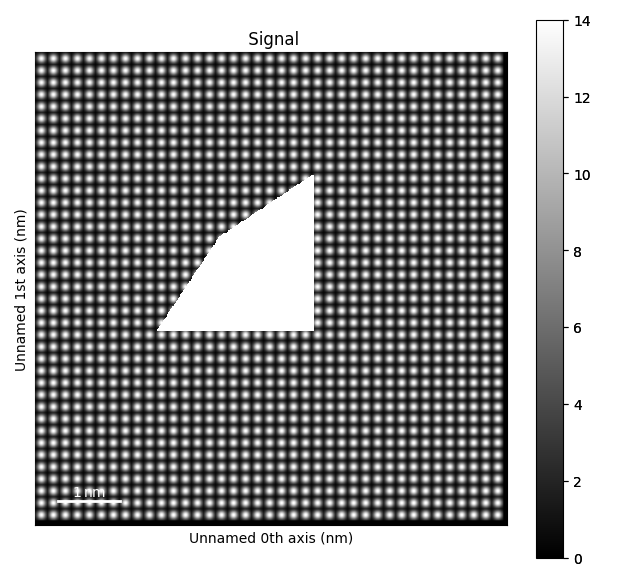
In some cases, it is easier to choose the area to remove rather than keep.
By using the inverted parameter, everything except the ROI will be retained:
s_roi_inv = roi(s, inverted=True)
s_roi_inv.plot()

Total running time of the script: (0 minutes 3.724 seconds)
