Note
Go to the end to download the full example code.
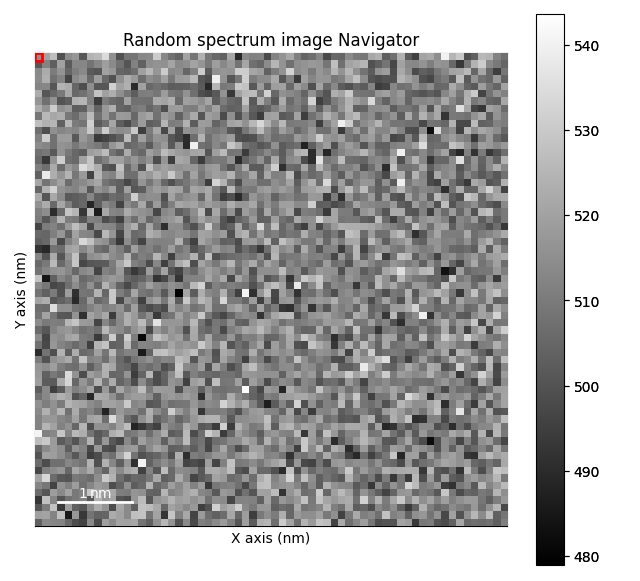
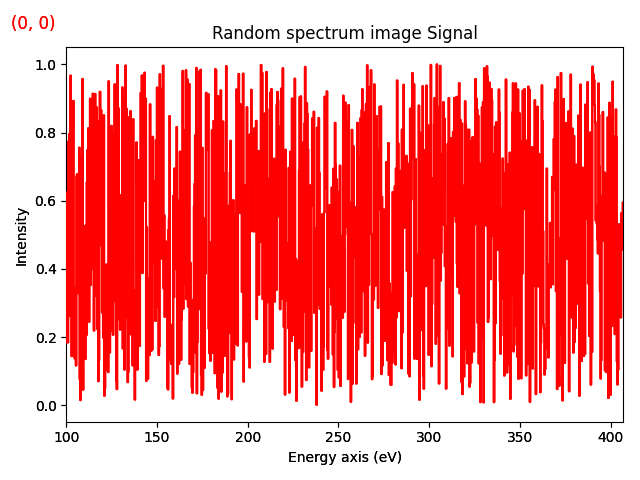
Creates a spectrum image#
This example creates a spectrum image, i.e. navigation dimension 2 and signal dimension 1, and plots it.
import numpy as np
import hyperspy.api as hs
import matplotlib.pyplot as plt

# Create a spectrum image with random data
s = hs.signals.Signal1D(np.random.random((64, 64, 1024)))

# Define the axis properties
s.axes_manager.signal_axes[0].name = 'Energy'
s.axes_manager.signal_axes[0].units = 'eV'
s.axes_manager.signal_axes[0].scale = 0.3
s.axes_manager.signal_axes[0].offset = 100

s.axes_manager.navigation_axes[0].name = 'X'
s.axes_manager.navigation_axes[0].units = 'nm'
s.axes_manager.navigation_axes[0].scale = 0.1
s.axes_manager.navigation_axes[0].offset = 100

s.axes_manager.navigation_axes[1].name = 'Y'
s.axes_manager.navigation_axes[1].units = 'nm'
s.axes_manager.navigation_axes[1].scale = 0.1
s.axes_manager.navigation_axes[1].offset = 100

# Give a title
s.metadata.General.title = 'Random spectrum image'

# Plot it
s.plot()

plt.show()  # No necessary when running in the HyperSpy's IPython profile
Total running time of the script: (0 minutes 0.983 seconds)